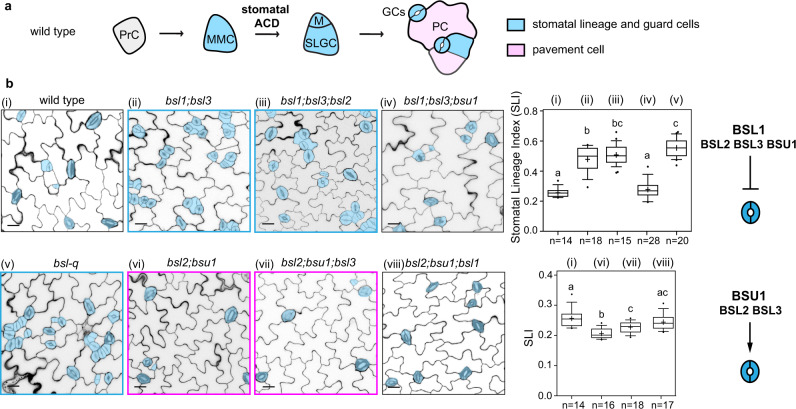
Fig. 1. Opposing regulation of BSL genes in stomatal development.
a Schematic diagrams to describe stomatal development in Arabidopsis. PrC (Protodermal Cell), MMC (Meristemoid Mother Cell), M (Meristemoid), SLGC (Stomatal Lineage Ground Cell), GCs (Guard Cells), and PC (Pavement Cell). Blue shade, stomatal lineage, and guard cells; Pink shade, non-stomatal pavement cells. b Left: (i–viii) Confocal images show stomatal phenotypes in adaxial cotyledon epidermis of a 5-dpg (day post germination) wild-type or a bsl mutant plant. Stomatal lineage and guard cells are manually traced (blue). Scale bars, 20 μm. Blue boxes highlight the genotypes producing more stomatal lineage cells and pink boxes highlight the genotypes producing fewer stomatal lineage cells. Middle: Plot boxes show Stomatal Lineage Index (# stomata lineages relative to # total cells) of the designated genotypes. Box plot shows first and third quartiles, median (line), and mean (cross). Letters were assigned by ANOVA and Tukey’s multiple comparison test (P ≤ 0.01). Exact P values obtained by unpaired t-test are 7.58e−10 for i vs. ii, 7.569e−20 for i vs. iii, 0.2435 for i vs. iv, 5.165e−18 for i vs. v, 1.77718e−05 for i vs. vi, 0.0045948 for i vs. vii, 0.2213566 for i vs. viii, 0.2179877 for ii vs. iii, 9.5308e−09 for ii vs. iv, 0.003676 for ii vs. v, 0.01535 for iii vs. v, 0.0014766 for vi vs. vii, 1.33323e−05 for vi vs. viii, 0.0336666 for vii vs. viii. n, number of cotyledons used for quantification of each genetic background. Right: Graphics describe differential regulation of the BSL genes in stomatal development. A complete panel of bsl mutant analysis can be found in Supplementary Fig. 2.

