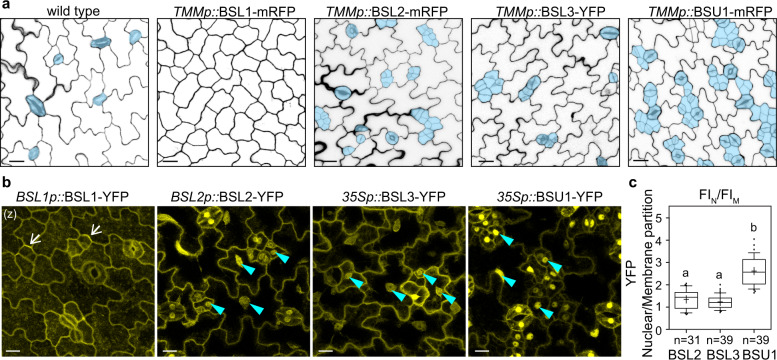
Fig. 2. Differential overexpression phenotypes and subcellular localization of BSL proteins in stomatal lineage cells.
a Confocal images show stomatal phenotypes induced by overexpression of the BSL genes in the stomatal lineage cells (driven by the stomatal lineage TMM promoter) in 5-dpg adaxial cotyledon epidermis. Cell outlines were visualized with propidium iodide (PI)-staining. Stomatal lineage and guard cells are manually traced (blue). Data represent results of three independent experiments. Scale bars, 20 μm. b Subcellular localization of the BSL proteins (yellow) in stomatal lineage cells in 3-dpg Arabidopsis adaxial cotyledon epidermis. Note, BSL1 is mainly cytoplasmic, close to the cell periphery and polarized (arrows); BSL2, BSL3, and BSU1 are cytoplasmic and nuclear (cyan arrowheads). Data represent results of three independent experiments. Scale bars, 10 μm. (z), all images are z-stacked. c Quantification of nuclear/membrane (N/M) partition of BSL–YFP by measuring fluorescence intensity (FI) of z-stacked images. Box plots show the first and third quartiles, split by the median (line) and mean (cross). n, number of stomatal lineage cells used for quantification. Letters were assigned by ANOVA and Tukey’s multiple comparison test (P ≤ 0.01). Exact P values are 0.2208 for BSL3 vs. BSL2 and 1.69335e−12 for BSU1 vs. BSL2, respectively, by unpaired t-test.

