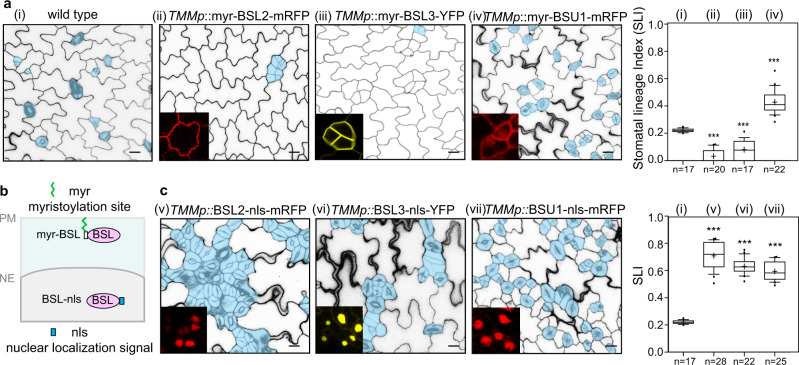
Fig. 3. Opposite regulation of BSL proteins at the PM vs. in the nucleus.
a Stomatal phenotypes in 5-dpg adaxial cotyledon epidermis overexpressing myristoylated (myr) BSL proteins (driven by the TMM promoter). Stomatal lineage cells are manually traced (blue). Insets (red and yellow) show protein localization in stomatal lineage cells. Note, myr-BSL2/BSL3 were solely found at the plasma membrane and myr-BSU1 was localized to the PM, cytoplasm, and nucleus. Each representative confocal images were selected from at least 10 individual cotyledons. Scale bar, 20 μm. b Schematic diagram depicts engineered BSL proteins for functional testing at the PM (myr-BSL) or in the nucleus (BSL-nls). PM, plasma membrane; NE, nuclear envelope. c Stomatal phenotypes in 5-dpg adaxial cotyledon epidermis overexpressing nuclear BSL-nls proteins (driven by the TMM promoter). Insets (red and yellow) show protein localization in the nucleus. Box plots in a and c show the first and third quartiles, split by the median (line) and mean (cross). n, number of biologically independent cotyledons from two homozygous transgenic lines (T3). Statistical analysis was performed to compare with the wild-type values. Unpaired t-test, ***P < 0.0001. Exact P values are 6.65262e−15 for i vs. ii, 1.19704e−7 for i vs. iii, 9.91101e−11 for i vs. iv, 6.4315e−21 for i vs. v, 1.70435e−21 for i vs. vi, 5.90558e−21 for i vs. vii.

