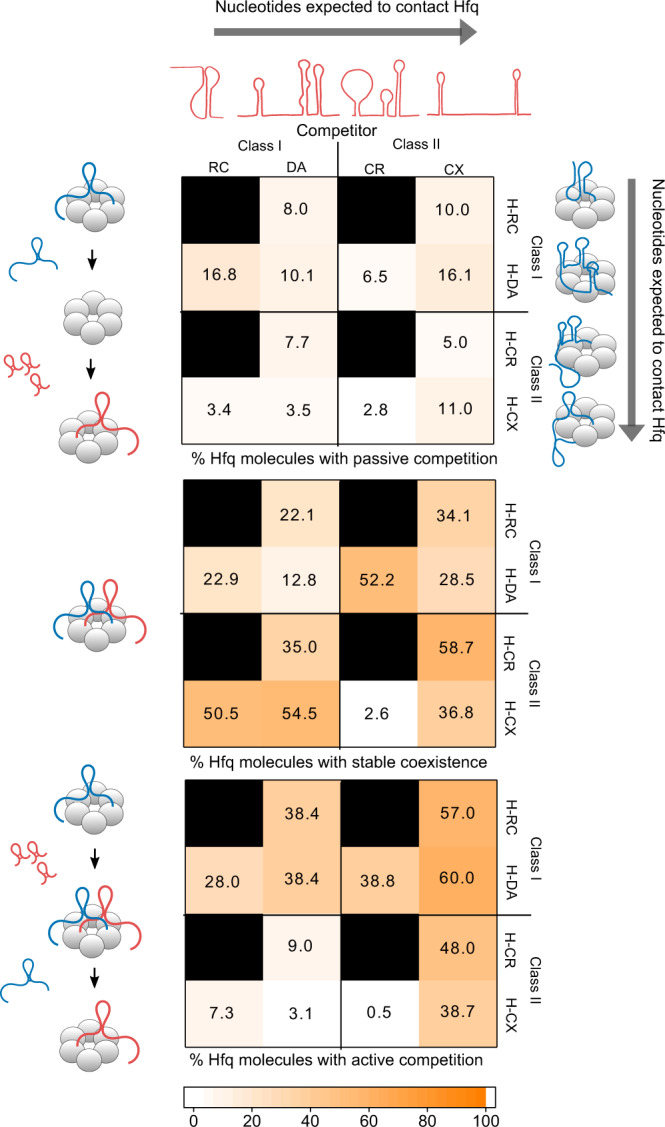
Fig. 5. sRNA·Hfq interactions modulate competition strategies.

Heat maps depicting the percent of resident·Hfq complexes that experience passive competition (top), stable coexistence (middle), and active competition (bottom) for various resident and competitor combinations; H: Hfq, RC: RydC, DA: DsrA, CR: CyaR, CX: ChiX. Average and s.e.m of two independent experiments; see Supplementary Tables 6–8 and 12 for details. The cartoons represent the determined or predicted sRNA structures and their interactions with Hfq. The values in the three heat maps may not sum to 100% because some Hfq complexes do not experience any type of competition during the movie, and others exhibit both stable coexistence and resident displacement (active competition). Source data are provided as a Source Data file.
