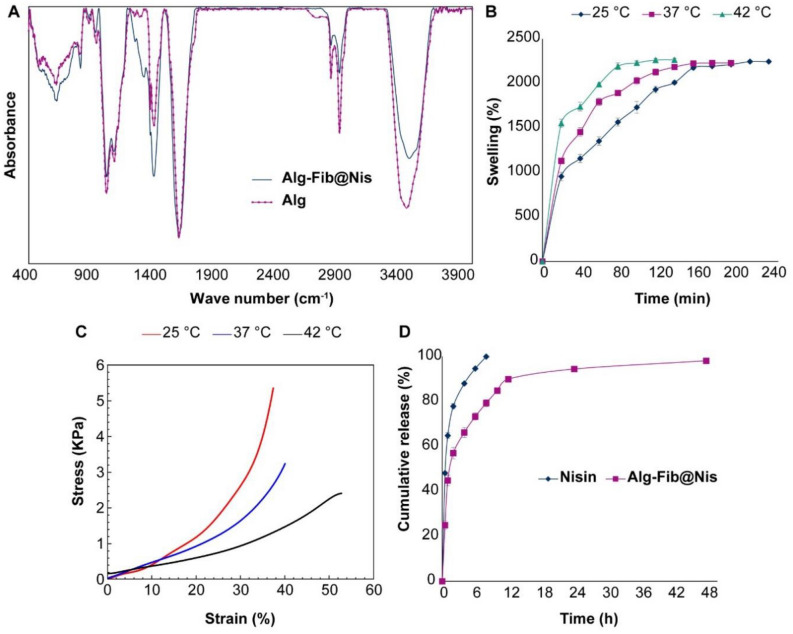
Figure 3.
(A) FTIR spectra of Alg-Fib@Nis-EDTA hydrogel and alginate polymer. (B) The swelling percentages of the Alg-Fib@Nis-EDTA hydrogel over time at various temperatures. The highest swelling percentage was at 240 (2244 ± 13%), 200 (2229 ± 9%), and 140 (2264 ± 17%) min after the incubation at 25, 37 and 42 °C, respectively. Values are mean ± SD, n = 3. SD: standard deviation. (C) Stress–strain diagram of the hydrogels after swelling in 25, 37, and 42° C using the extension rate of 5 mm/min. (D) Release profile of nisin from Alg-Fib@Nis-EDTA hydrogel compared to free nisin at different times in PBS at 37 °C. Data points are mean ± SD, (n = 3). SD: standard deviation.

