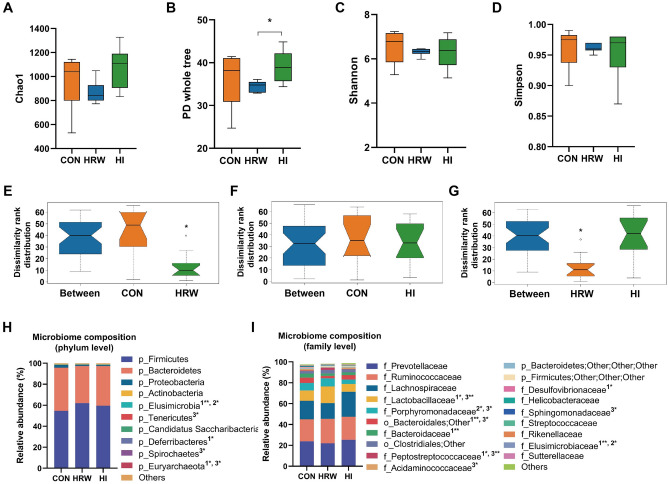
Figure 4.
Analysis of bacterial community composition among three groups. (A–D) Alpha-diversity of bacterial community was measured by Chao1 (A), PD whole tree (B), Shannon (C), and Simpson (D); (E–G) ANOSIM was performed to quantitatively compare the bacterial community differences between different groups. (H,I) Community bar-plot analysis shows relative abundance of microbiota in each group at the phylum level (H) and family level (I), n = 6, in each group.

