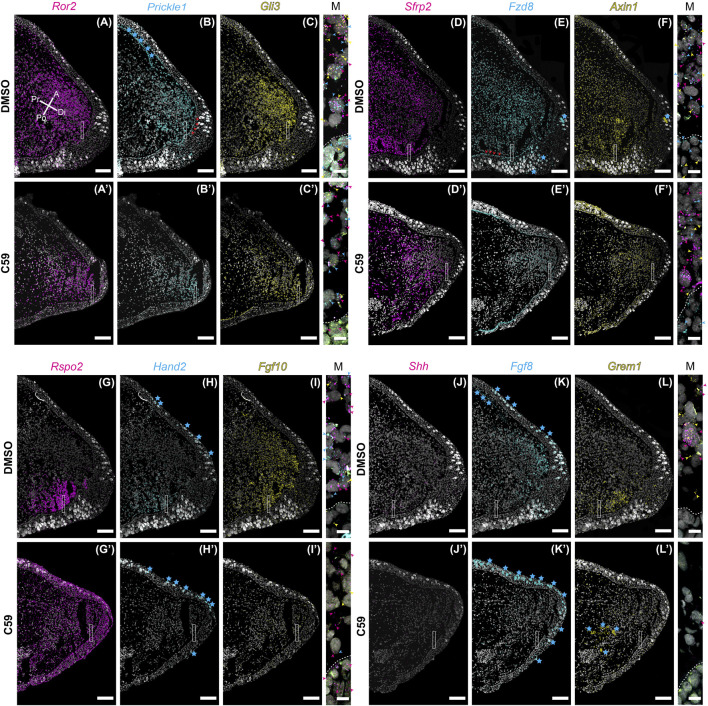
FIGURE 8.
Gene expression of limb patterning genes in mid bud axolotl forelimb blastemas. (A–L′) HCR-FISH was performed on coronal sections of a forelimb blastema at the mid bud stage, 20 dpa. C59 treatment started on 18 dpa. The few non-specific dots located outside of the limb were removed for clarity. Scale bars (A–L′) are 250 µm. Scale bars in close-up merged images were 20 µm. (A) Ror2 expression in a DMSO-treated limb showing very strong expression throughout the mesenchyme and lesser expression in the epithelium. Pr is proximal, A is anterior, Di is distal, and Po is posterior. (A′) Generally decreased expression of Ror2 in a C59-treated limb. (B) Prickle1 expression in the blastema mesenchyme and basal epithelium, indicated by red arrowheads. Blue stars indicate autofluorescent basal lamina in the epidermis and the dermis. (B′) Expression of Prickle1 after C59 treatment showing similar, but less frequent signal. (C) Strong Gli3 expression in the mesenchyme of the blastema. (C′) Expression of Gli3 after C59 treatment showing similar, but less frequent signal. The merged image of (A–C) shows variable expression across cells for Ror2, Prickle1, and Gli3, highlighted by colored arrowheads. (D) Sfrp2 strongly expressed throughout the blastema mesenchyme. (D′) Sfrp2 expression similar in a C59-treated limb compared to the DMSO-treated limb. (E) Mesenchymal and basal epithelial expression of Fzd8. Red arrowheads highlight expression in the basal epithelium. Blue stars indicate autofluorescent Leydig cells in the epithelium. (E′) Similar expression in the C59-treated limb, but at lower levels. (F) Low expression of Axin1 throughout the blastema mesenchyme with very low expression in the epithelium. (F′) Similar Axin1 expression pattern in a C59-treated limb compared to control limbs, except at a lower level. (G) Rspo2 expression in the posterior mesenchyme of the blastema. (G′) Rspo2 broadly expressed in both the mesenchyme and epithelium of a C59-treated blastema. (H) Posterior mesenchymal expression of Hand2 in the limb blastema. Autofluorescent Leydig cells are highlighted with blue stars. (H′) Lack of expression for Hand2 in the C59-treated limb blastema. (I) Fgf10 mainly expressed in the mesenchyme. (I′) Fgf10 expression nearly absent in the C59-treated blastema. (J) Posterior expression of Shh in few, but highly expressing cells in the posterior blastema mesenchyme. The lack of stronger expression is likely due to the tissue section not beingincluding much of the posterior Shh domain. Strong Shh expression is observed in whole-mount staining in Supplementary Figure S2. (J′) Very little Shh expression was observed in C59-treated limbs, which was confirmed by whole-mount imaging. (K) Distal/anterior mesenchymal expression of Fgf8 in the regenerating blastema. Blue stars indicate autofluorescent Leydig cells and dermis. (K′) Fgf8 transcripts absent in the C59-treated limb. (L) Posterior mesenchymal expression of Grem1 in a broader domain than Shh. (L′) Very little Grem1 expression in the C59-treated limb.

