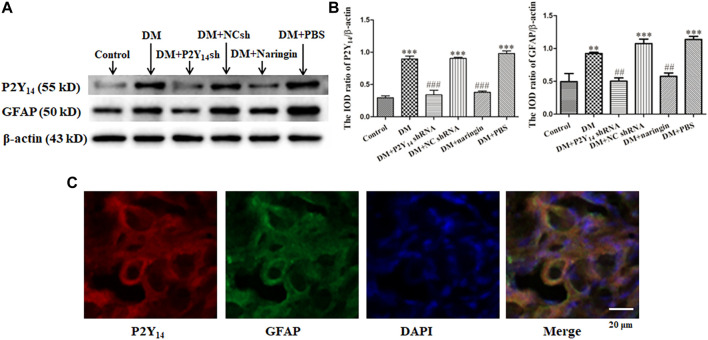
FIGURE 1.
The expression levels of the P2Y14 receptor and GFAP in SCG. The protein expression levels of P2Y14 and GFAP were assessed by Western blotting (A). The bar histogram shows the integrated optical density (IOD) ratio of P2Y14 and GFAP protein mass to β-actin protein mass (actin as an internal control for normalization) in each group (B), and the values are the mean ± SEM from three independent experiments. ***p < 0.001 vs. Ctrl; ###p < 0.001 vs. DM. The expression of P2Y14, GFAP, and DAPI in the SCG was detected by immunofluorescence staining (C). The red signal indicates P2Y14 staining with TRITC, the green signal represents GFAP staining with FITC, and the blue signal shows DAPI stain for labeling DNA. The merged image represents the three staining of P2Y14, GFAP, and DAPI. Scale bar, 20 μm.

