FIGURE 2.
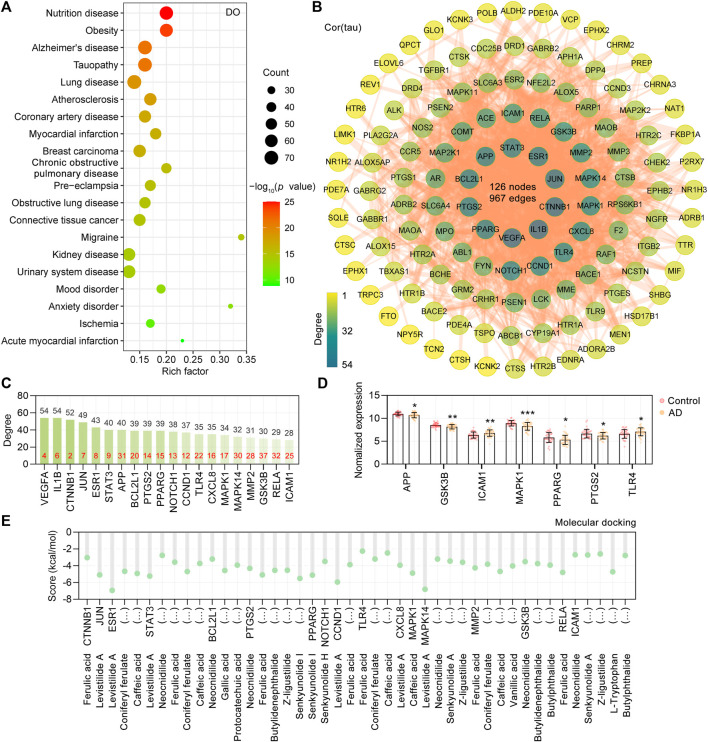
PPI network of CR targets associated with tau pathogenesis. (A) Top 20 significantly enriched Disease Ontology (DO) terms are shown as a bubble diagram. DO terms with corrected p value <0.05 were considered significantly enriched. The x-axis, rich factor (the ratio of targets in the background terms). Bubble size, the number of genes enriched. Bubble color, p value. (B) 127 targets related to tau pathogenesis were utilized to construct the PPI network. The color of the node correlates with its degree value. (C) The top 20 targets ranked by degree value were identified as the core targets. The red numbers in the bar chart represent the degree value ranking of the core targets in the CR’s 376 target PPI network. (D) Differentially expressed core targets of CR related to tau pathogenesis in the temporal cortex of the control (n = 39) and AD group (n = 52). Data are plotted as individual data points overlaid with mean ± SD. *p < 0.05, **p < 0.01, ***p < 0.001. (E) Docking score (kcal/mol) of CR phytochemicals with their corresponding core targets.

