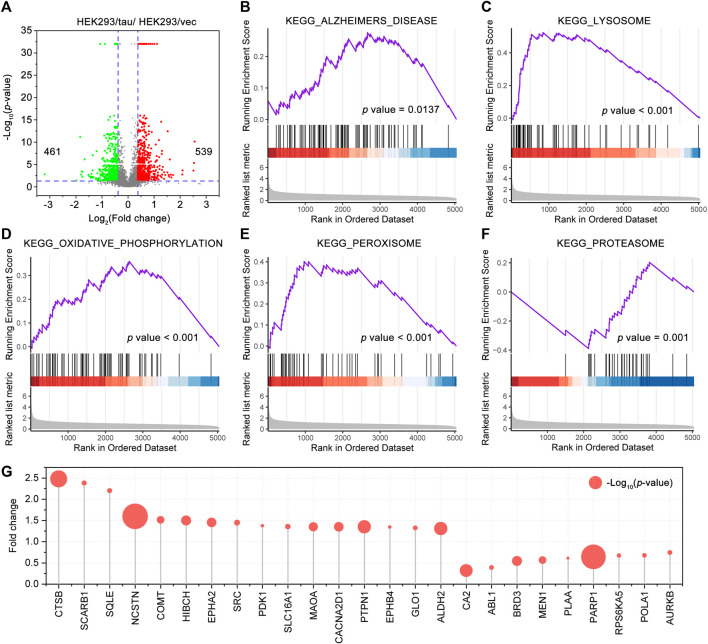
FIGURE 4.
Gene set enrichment analysis (GSEA) of the proteins in HEK293/tau cells (stable overexpressing human wild-type full-length tau) and HEK293/vec cells. (A) Volcano plot showing the differentially expressed proteins, which were as differentially expressed when fold change >1.3 and p < 0.05, between HEK293/tau cells and HEK293/vec cells. GSEA of the proteins identified by proteomics. KEGG_ALZHEIMERS DISEASE (B), the KEGG LYSOSOME (C), KEGG OXIDATIVE PHOSPHORYLATION (D), KEGG PEROXISOME (E), and KEGG PROTEASOME (F) were significantly enriched. (G) The common proteins of the differentially expressed protein data set (HEK293/tau vs HEK293/vec cells) and CR target data set. The size of each bubble point represents the corresponding p value.

