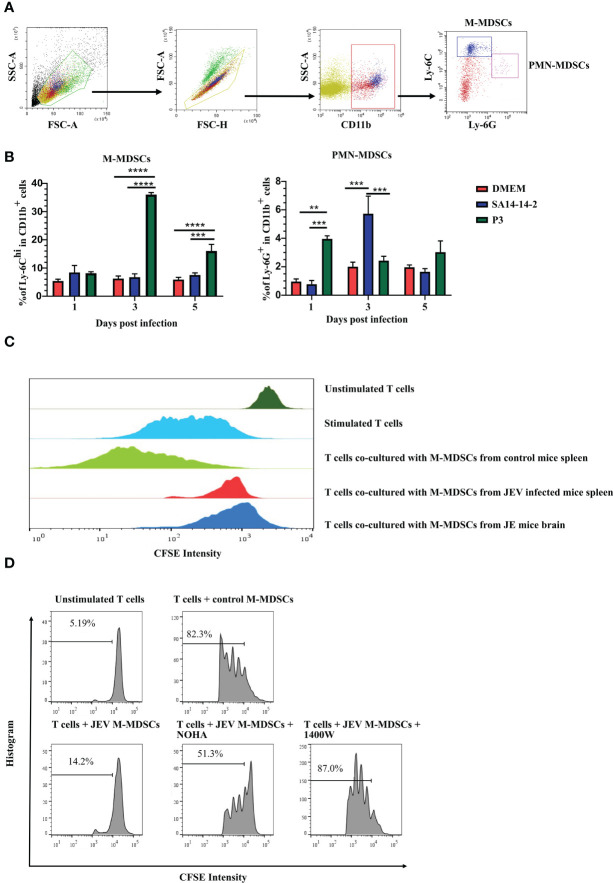
Figure 2.
JEV infection expands M-MDSC generation. (A) Flow cytometry gating strategy for MDSCs. (B) Bar graphs show the M-MDSC and PMN-MDSC ratios in the spleen at 1, 3, and 5 days post-infection (n = 4). (C) M-MDSCs were sorted from the spleens of mock- and JEV-infected mice, and the brains of JE mice, then mixed with CFSE-labeled CD8+ T cells (pre-stimulated with 2.5 μg/mL ConA) at a ratio of 1:1. The inhibition of T cell proliferation was assessed after 3 days incubation at 37°C. The proliferation of CD8+ T cells was analyzed using flow cytometry. (D) Proliferation of CD8+ T cells in the presence of M-MDSCs from the spleen and NOHA or 1400W. Representative results from repeated experiments are shown. **p < 0.01, ***p < 0.001, and ****p < 0.0001.

