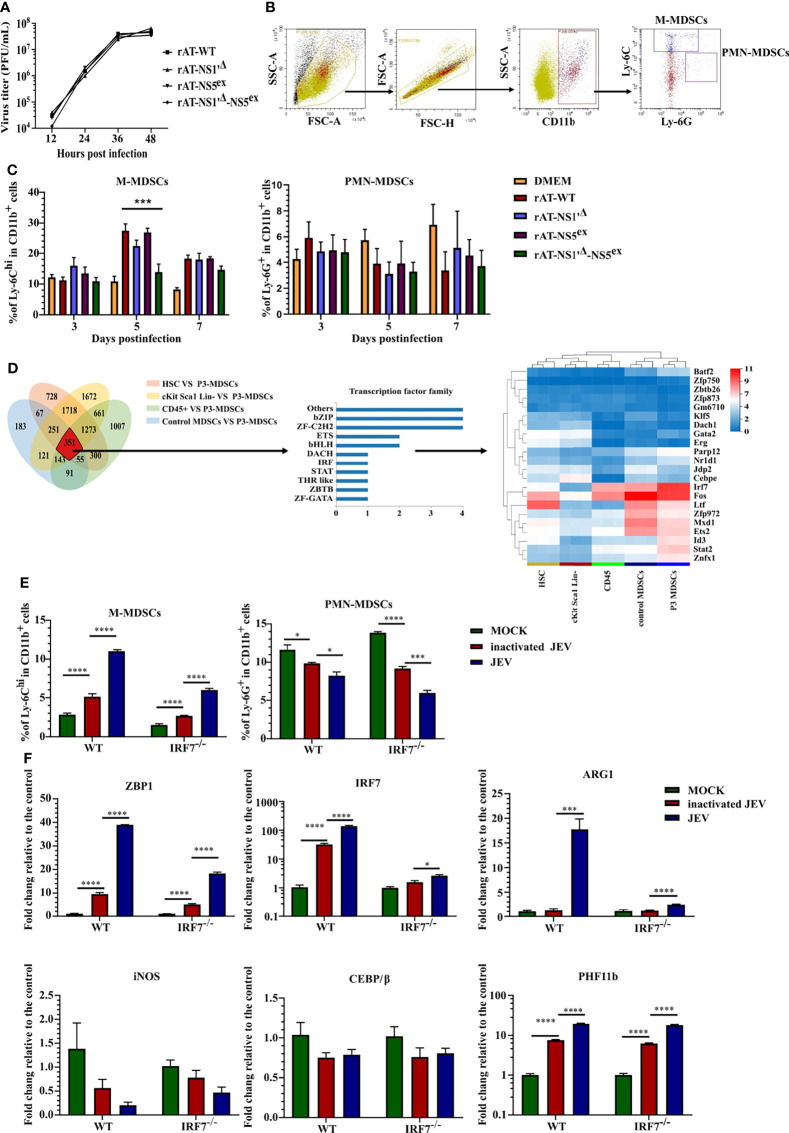
Figure 3.
JEV induces M-MDSC generation through the IRF7 signaling pathway. (A) Replication kinetics of different rAT viruses in BHK-21 cells. (B) Flow cytometry gating strategy for MDSCs. (C) Bar graphs show the M-MDSC and PMN-MDSC ratios in the spleen after infection with different rAT viruses at 3, 5, and 7 days post-infection (n = 4). (D) Venn diagram and cluster heat map showing differentially expressed transcription factors among samples. (E, F) WT and IRF7 KO bone marrow cells were infected with inactivated or live JEV (MOI = 1). (E) The M-MDSC and PMN-MDSC ratios were determined using flow cytometry. (F) ZBP1, IRF7, ARG1, iNOS, CEBE/β, and PHF11b mRNA expression were determined using real-time PCR at 72 h post-infection (n = 4). Representative results of repeated experiments are shown. *p < 0.05, ***p < 0.001, and ****p < 0.0001.

