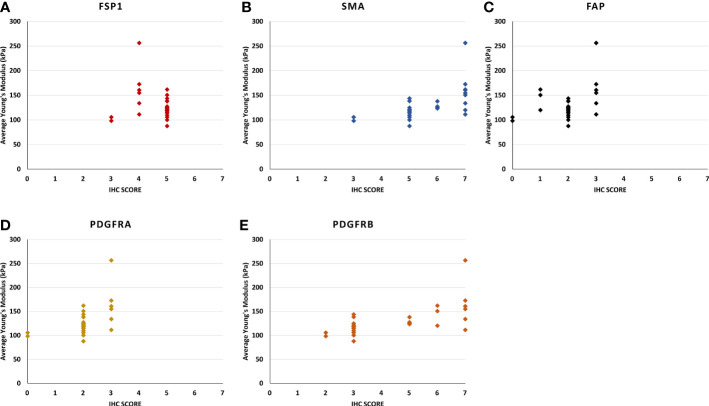
Figure 4.
The scatter plots show the relationship between the stiffness of the Ultrasound shear wave elastography and the score of immunohistochemistry intensity and density in (A) FSP1, (B) SMAα, (C) FAP, (D) PDGFRα, and (E) PDGFRβ. (B) [rs (28) = 0.73, p < 0.0010], and (E) [rs (28) = 0.73, p < 0.001], the correlation of the other genes were not statistically significant.

