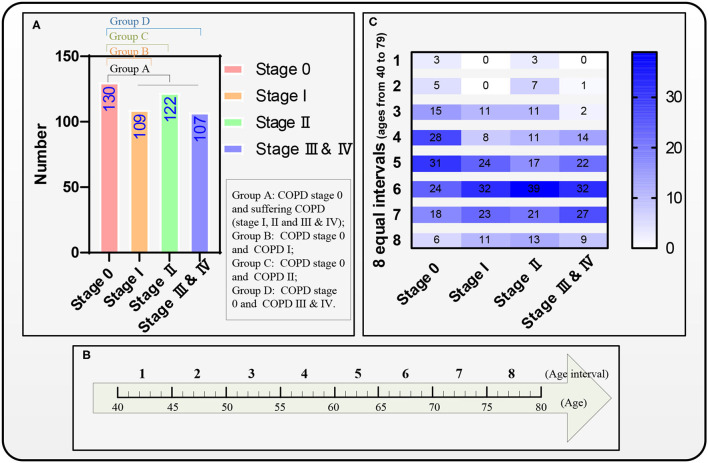
Figure 4.
Four groups A–D, eight equal age interval divisions, and the distribution map of the eight equal age intervals. (A) A distribution map of the four groups A–D, (B) The eight equal age intervals from the age of 40 to 79 years, and (C) Another distribution map of the eight equal age intervals.

