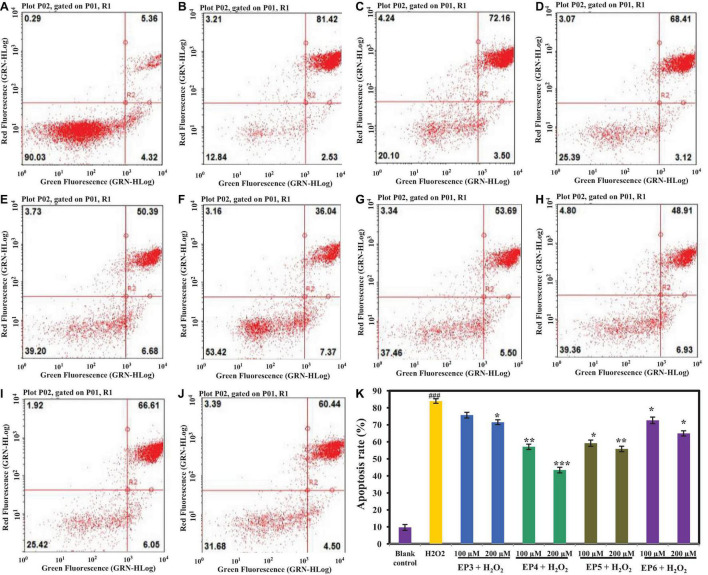
FIGURE 8.
Effects of the antioxidant peptides (EP3–EP6) on HUVEC apoptosis determined by annexin V and propidine iodide (AV-PI) staining. In the Figure 8A–J, the left upper quadrant (LU) represents necrotic cells (annexin-/PI +), the left lower quadrant (LL) represents normal living cells (annexin-/PI-), the right lower quadrant (RL) represents the early apoptotic cells (annexin + /PI-) and the right upper quadrant (RU) represents late apoptotic cells (annexin + /PI +). (A) Blank control refers to normal cells without any treatment; (B) H2O2-induced model (300 μm for 6 h); (C) EP3 (100 μm) + H2O2 (300 μm for 6 h); (D) EP3 (200 μm) + H2O2 (300 μm for 6 h); (E) EP4 (100 μm) + H2O2 (300 μm for 6 h); (F) EP4 (200 μm) + H2O2 (300 μm for 6 h); (G) EP5 (100 μm) + H2O2 (300 μm for 6 h); (H) EP5 (200 μm) + H2O2 (300 μm for 6 h); (I) EP6 (100 μm) + H2O2 (300 μm for 6 h); (J) EP6 (200 μm) + H2O2 (300 μm for 6 h); (K) the apoptosis rates of HUVECs when the concentrations of blank control, H2O2-induced model group, 100 μm and 200 μm EP3–EP6 + H2O2 (300 μm for 6 h) (###p < 0.001 vs. blank control group; ***p < 0.001, **p < 0.01, *p < 0.05 vs. H2O2-induced model group).

