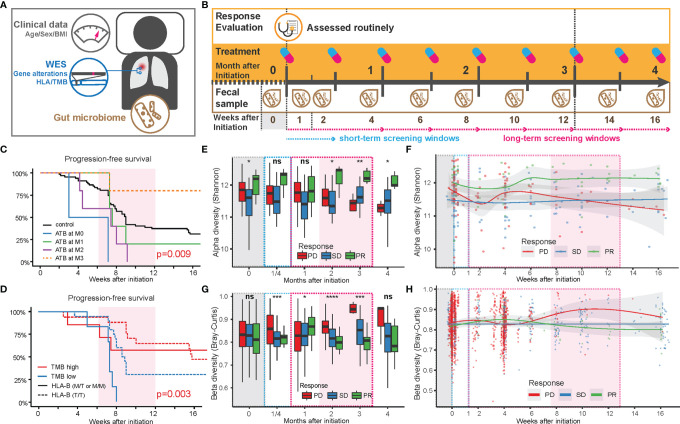
Figure 1.
Factors influencing the anti-PD-1 responsiveness in Chinese NSCLC patients. (A) Sample collection pipeline, including anthropometrics (age, sex, and BMI), tumor mutations based on somatic tumor and normal tissue, blood, and fecal samples. (B) Collection timeline. After 3 months of routinely/regularly administration and response evaluation (see Methods), patients were grouped based on partial response (PR), stable disease (SD), or progressive disease (PD), according to the criteria in RECIST 1.1. Fecal samples were collected at the end of each treatment period. Feces from the first week after initiation of treatment (W1) was collected within 3 days after the first treatment. (C) Comparison of progression-free survival of patients with or without antibiotics before and after treatment. (D) Comparison of progression-free survival of patients with TMB above or below 5.6 (red or blue lines) in patients with a high level of HLA-E type (HLA-B rs1050458 Met/Thr or Met/Met, solid lines) or low level (HLA-B rs1050458 Thr/Thr, dashed lines) of HLA-E type. (E) Changes in alpha diversity in the gut microbiota over time in each response group, displayed as a box plot where MIN and MAX corresponds to 9.59 and 12.7, respectively. Significance level (Kruskal–Wallis): **** for p < 0.0001, *** for p < 0.001, ** for p < 0.01, * for p < 0.05 and ns for non-significant. (F) Changes in alpha diversity in the gut microbiota over time in each response group, displayed with smooth-fit lines. The p-values of the longitudinal group comparison (splinectomeR) were 0.503 for PD vs. SD, 0.031 for PD vs. PR, and 0.005 for SD vs.PR. (G) Changes in beta diversity (Bray–Curtis dissimilarity) in the gut microbiota over time in each response group, displayed as a box plot where MIN and MAX correspond to 0.54 and 0.99, respectively. Significance level (Kruskal–Wallis): **** for p < 0.0001, *** for p < 0.001, ** for p < 0.01, * for p < 0.05 and ns for non-significant. (H) Changes in beta diversity in the gut microbiota over time in each response group, displayed with smooth-fit lines. The p-values of the longitudinal group comparison (splinectomeR) were 0.114 for PD vs. SD, 0.239 for PD vs. PR and 0.042 for SD vs.PR.

