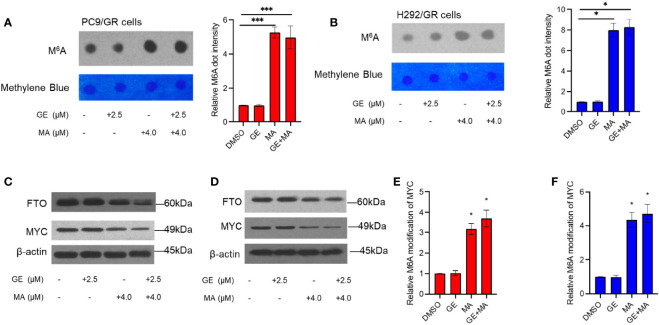
Figure 6.
MA and GE in combination upregulated FTO-mediated MYC M6A modification. (A, B) Dot blot shows the M6A modification level in PC9/GR and H292/GR cells exposed to MA and GE for a single drug or combination. (C, D) Expression of FTO and MYC determined by Western blot assays in PC9/GR and H292/GR cells. (E, F) The m6A modification level of MYC cells was assessed by Me-RIP assay in PC9/GR and H292/GR cells exposed to MA and GE for a single drug or in combination. Data are presented for at least three independent repetitions and were illustrated as mean ± SD. *p < 0.05, ***p < 0.001.

