Abstract
The coronavirus (COVID-19) pandemic has caused disastrous results in most countries of the world. It has rapidly spread across the globe with over 156 million cumulative confirmed cases and 3.264 million deaths to date, according to World Health Organization (WHO) Coronavirus Disease (COVID-19) Dashboard. With these huge amounts of causalities in the world, Geographic Information Systems (GIS) as a computer-based analyzer could help governments, experts, medical staff, and citizens to prevent and respond to the incidence. On the other hand, the COVID-19 pandemic involves many unknown parameters where most of them have a spatial dimension. Thus, spatial analysis and GIS could provide appropriate decision-making tools, predictive models, statistical methods, and new technologies for COVID-19 outbreak control, also help the people for avoiding direct contact and preserving social distance. This article aims to review the most promising categories of GIS-based solutions in this domain. We divided the solutions into ten classes including spatio-temporal analysis, SDSS approaches, geo-business, context-aware recommendation systems, participatory GIS and volunteered geographic information (VGI), internet of things (IoT), location-based service (LBS), web mapping, satellite imagery-based analysis, and waste management. The main contribution of this paper is proposing different geospatial guidelines that could provide reliable and useful protocols for COVID-19 outbreak control to minimize causalities, restrict incidence, establish effective urban communication, provide new approaches for business in lockdown situations, telehealth treatment, patient monitoring, adaptive decision making, and visualize trend analysis.
Keywords: GIS-based solutions, COVID-19, Outbreak, Social distancing, Lockdown
Introduction
COVID-19 is a novel coronavirus infecting animals and humans. Infected human may show no or mild symptoms, to the severe incidence that cause death. It was first reported from Wuhan, China in December 2019, and soon spread to the rest of the country and other countries as a public health emergency of international concern [1]. There were more than 156 million cases of COVID-19 and 214.468 million cumulative deaths reported as of Aug 28, 2021, according to the WHO Coronavirus Disease (COVID-19) Dashboard [1]. COVID-19 pandemic has introduced many challenges in our lives and livelihoods and brought into the picture the need for a trans-disciplinary view of the current crisis through various angles of global governance, technology, and risk communication [2].
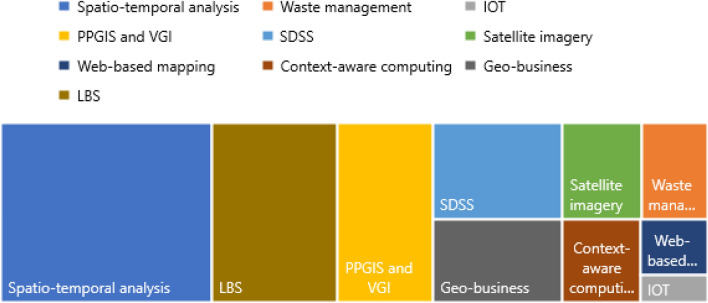
Geographic Information Systems (GIS) as a framework for gathering, managing, analyzing, and visualizing geographic and location-based data has been widely used in public health studies (e.g., [3–8] and can support various applications and protocols for COVID- 19 outbreak prevention and control [9]. Some new technologies and computing approaches have become commonplace in everyday life such as IoT and context-aware computing [10–15]. According to our investigations, there are ten distinct categories for GIS-based solutions on managing epidemic and pandemic diseases as illustrated in Fig. 1. This paper defines most of the capabilities of these categories in COVID-19 outbreak prevention and control.
Fig. 1.
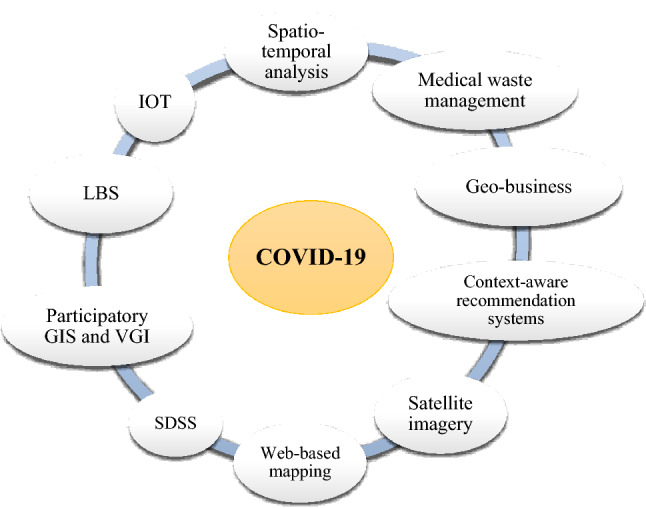
Ten GIS-based solutions for COVID-19 pandemic outbreak control
The rest of the paper demonstrates the properties and possibilities of the mentioned ten groups and the related research that used these methods in studying COVID-19. Then, the conclusions are drawn to clear the horizon of using the GIS-based solution in pandemic diseases.
Ten GIS-Based Solutions for COVID-19 Outbreak Prevention and Control
Our studies in the use of categorized GIS-based approaches in pandemic and epidemic diseases, before the advent of COVID-19, include 124 papers from Science Direct, Springer, ResearchGate, and Google Scholar, the proportion of each group shown in Fig. 2.
Fig. 2.
The ratio of the use of GIS-based methods in previous research
As can be seen, the main category is related to spatio-temporal analysis in pandemic and epidemic diseases, while the least research is related to IoT-based approaches. Based on the more common use of methods in previous articles, the following expresses the GIS-based capabilities and approaches that can be used in COVID-19 outbreak prevention and control.
Spatio-temporal Analysis
Spatio-temporal spreads of COVID-19 have been recently reported in different countries [16–20]. Usually, the environmental characteristics of places are various especially in the scale of a province and a country. For example, no connection was found between COVID-19 cases and temperature in Spain in early Spring [21]. There were notable improvements in air quality reported from different countries during the lockdowns using regression-based spatio-temporal analysis [22–26].
On the other hand, some demographic characteristics of the urban environment could affect COVID-19 propagations. For example, in Kuwait, a significant relationship between the ‘densely populated areas and poor living conditions’ and COVID-19 spread was reported [27], a spatio-temporal relation between the celebrations and virus propagation was investigated [28], and human travel and stay-at-home mandates indicated by mobile phone location was coupled with COVID-19 incidence in the U.S. based on GIS and statistical analysis [29]. Table 1 shows some research that concentrated on spatio-temporal analysis of COVID-19 and related factors. The date column signifies the date of paper acceptance and publication.
Table 1.
Selected studies that used spatio-temporal analysis in COVID-19
| Study | Date | Spatio-temporal analysis | Subject |
|---|---|---|---|
| Luo et al. [30] | 2/17 | Regression | Correlation between the number of COVID-19 incidents and absolute humidity |
| Allam and Jones [31] | 2/27 | AI | Using universal data sharing standards and Artificial Intelligence (AI) to monitor and manage urban health |
| Bogoch et al. [32] | 3/13 | Data mining | Potential for the global spread of COVID-19 |
| Sangiorgio and Parisi [33] | 3/18 | GIS-MCDA | A multicriteria-based approach for analyzing the spread of COVID-19 in urban district lockdown |
| Zhou et al. [34] | 3/20 | Data mining | Reflections on the use of GIS with big data and spatiotemporal analysis of COVID-19 |
| Kang et al. [35] | 3/26 | Moran’s I spatial statistic | Investigating spatial dynamics of the COVID-19 in China |
| Chan et al. [36] | 3/29 | Web mapping/data mining | Analysis with mobility data from Google users |
| Tosepu et al. (2020) [37] | 4/3 | Regression | Correlation between climate and COVID-19 in Jakarta |
| Gupta et al. [38] | 4/19 | Data mining | Correlation between climatic characteristics and the spread of the virus in the USA, and extrapolation of the method to India |
| Allcott et al. [39] | 4/7 | Regression | Correlation between the ruling party in each county, social behavior, and confirmed COVID-19 cases |
| Velásquez and Mejía Lara [40] | 5/20 | Regression | Evaluating the spread of COVID-19 in the USA with Gaussian process regression |
| Cuevas [20] | 5/25 | Agent-based modeling | Using an agent-based model to assess the COVID-19 spread in facilities |
| Franch-Pardo et al. [41] | 6/4 | Data mining | A review of spatial analysis and GIS in studying COVID-19 |
| Jin et al. [42] | 6/9 | Interpolation | Examining the time, place, and population of COVID-19 in China between Jan 20 and Feb 10, 2020 |
| Pourghasemi et al. [43] | 6/17 | Regression/Random Forest | Spatial analysis and modeling of COVID-19 in Iran between Feb 19 and Jun 14, 2020 |
| Huang et al. [16] | 6/17 | Logistic regression model | Spatio-temporal analysis of COVID-19 and its relationship with epidemiological characteristics, control of measures taken, and their effects |
| Cordes and Castro [18] | 6/18 | Cluster analysis | Spatial analysis of COVID-19 spread in New York City |
| Chatterjee et al. [44] | 6/20 | Timeline Series Analysis | An innovative COVID-19 Risk Assessment Tool |
| Karaye and Horney [45] | 6/26 | Geographically weighted regression | Analyzing the association between the number of COVID-19 cases and social vulnerability in the U.S |
| Kulkarni and Anantharama (2020) [46] | 6/30 | Multi-objective approaches | Examining the impact of COVID-19 pandemic on municipal solid waste management |
| Gao et al. [29] | 8/9 | Statistical model | Assessing the connection between human mobility changes and COVID-19 incidence in the U.S |
| Sannigrahi et al. [47] | 10/1 | Geographically weighted regression | Assessing the relationship between socio-demographic conditions and COVID-19 deaths in the European region |
| Briz-Redón and Serrano-Aroca [21] | 10/8 | Statistical model | Examining the influence of temperature on COVID-19 early evolution in Spain |
Regression-based models are the most popular and effective way of detecting the involving factors of COVID-19 prevalence. After that, data mining methods revealed new facts in this field accurately. In this method, usually, all independent effective factors are detected and their impression on the COVID-19 outbreak is assessed. Due to the essence of spatio-temporal modeling of the pandemic disease, the required data should be collected and prepared in specific temporal intervals. The results of executing regression-based models will enable the decision-makers to predict the level of prevalence spatio-temporally.
LBS in Lockdown and Social Distancing Situation
According to the definition of the international Open Geospatial Consortium [48], LBS is “a wireless-IP service that uses geographic information to serve a mobile user. Any application service that exploits the position of a mobile terminal.” LBS provides spatial services remotely, which is a basic requirement in lockdown and social distancing situations. This service could afford different daily activities of humans in indoor and outdoor spaces without any direct contact [49]. Figure 3 shows the main activities of citizens which could be carried out using LBS considering the social distance. Location-based services answers questions like [50–53]:
“Where am I”, “Where are the high/low-risk regions due to COVID-19 incidence”, “Where are the best places for recreation and amusement regarding the social distance parameter?”, “Where are safe places for walking?, “Which sidewalks have lower risk due to the COVID-19 outbreak?”, “Where are the most prone regions due to COVID-19 outbreak?”, “Where are the nearest places for receiving COVID-19 medical services?”, “Where are the most in-demand zones for receiving the desired product online?”.
What is nearby?”, “What is the temporal pattern of COVID-19 incidence risk in different places?”, “What is the daily schedule for urban commuting?”, “What was the last time a COVID-19 patient crossed a place (especially in indoor places)?”, “What should I do for preventing COVID-19 in this location?”.
“How can I go there to have the least risk due to COVID-19?”, “How is the health status of nearby people”, “How are the quality services of nearest COVID-19 health care services?”, “How can I deliver my daily healthy foodstuffs in a limited time?”, “How can I have some business with the other people in other places?”.
Fig. 3.
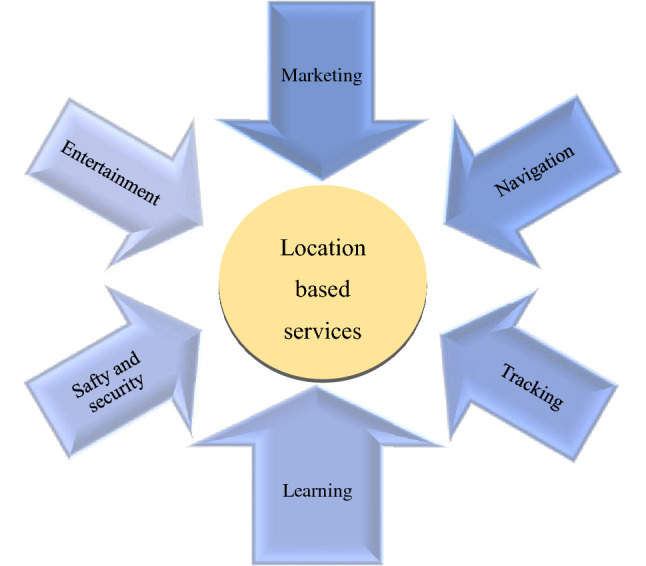
Different applications of LBS in lockdown and social distancing situation
As seen in Fig. 3, different daily activities can be facilitated using location-based services. Six categories have been considered as the main responsibilities of LBS in lockdown and social distancing situations. Among them, navigation in urban traffic networks is a very important task that could help the citizens and urban services using GPS-enabled mobile phones based on social distancing protocols [54, 55]. Another key duty is distance learning which provides learning services for any people, anywhere, anytime, and via any device [56]. Tracking the patients and their companions, also the hospital supplies and goods is one more mission of LBS that could aid to prevent outbreaks [57]. In this regard, the safety and security of transportation, tracking, the health information should be guaranteed by these types of services [58]. Location-based marketing and entertainment are the last categories of LBS which are very vital for citizens in distance trading and also pleasure trips. For example, introducing solitude resorts and low-risk tourism centers could help the people in the outbreak [59, 60].
Web Mapping
According to the Neumann definition [61], web mapping is “the process of designing, implementing, generating and delivering maps on the World Wide Web”. In other words, it is a technique of visualizing and sharing spatial and geographic data on the World Wide Web. Web mapping replies on the web to disseminate maps that require cartographic design. Web-based maps are online operational mapping designs consenting different geographical data to be displayed in digital internet-based platforms. These types of maps are rooted in web sheets or applications which could be implemented as interactive media [62].
With the increasing number of Internet users and the growing interest of citizens to deliver web services, also, as the dynamic characteristic of COVID-19 prevalence, web mapping is an essential awareness part of this pandemic. Since the main policy of preventing COVID-19 outbreak is social distancing, therefore, utilizing web mapping technologies in this situation will help the people for their daily activities. Indeed web-based near-real-time maps which indicate the outbreak intensity of COVID-19 enable the urban and health managers to decide on establishing controlling strategies. Also, the public and citizens could utilize form these maps to aware of the pandemic prevalence in different regions. As seen in Fig. 4, four key tasks could be done using web mapping technologies.
Fig. 4.
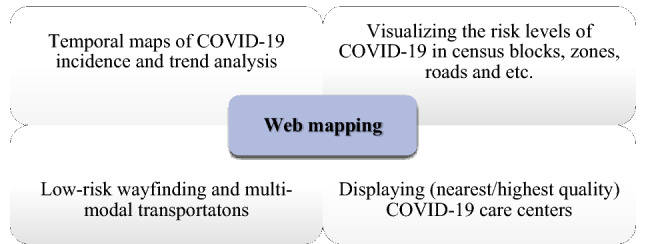
Different applications of web mapping in COVID-19 outbreak
Spatial pandemic extensively considers web-based maps as an effective way for studying the spread of transferrable diseases besides the other data. Developing well-intended maps can present numerous pieces of information into one interface [63].
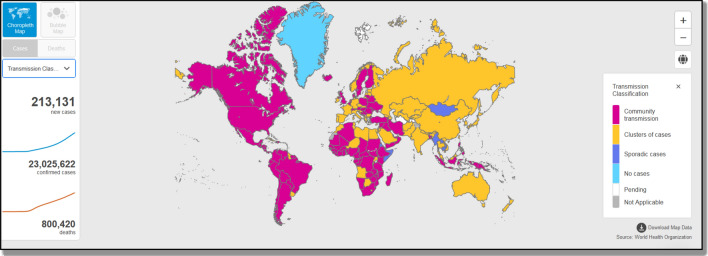
Figure 5 shows an example of COVID-19 outbreak web mapping. The map is dynamic and indicate the temporal changes of COVID -19 in different countries.
Fig. 5.
Transmission classification of COVID-19. (
Source: WHO Coronavirus Disease (COVID-19) Dashboard, URL: https://covid19.who.int/, accessed on Aug 22, 2020)
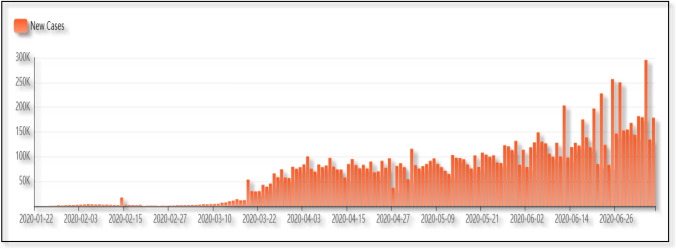
As seen, different facts can be concluded by interpreting the web maps of COVID-19 outbreak in different countries, also at various times. Usually, web mapping provides some reports and diagrams for users to conclude schematically [64]. For example, Bing developed a live web map COVID-19 Tracker. Figures 6 and 7 show the number of new cases and fatal cases from 2020-01-02 until 2020-06-26, respectively (https://www.bing.com/covid?vert=graph).
Fig. 6.
The diagram of new cases of COVID-19 in the world from 2020-01-02 until 2020-06-26. Microsoft product screen shot(s) reprinted with permission from Microsoft Corporation
Fig. 7.
The diagram of new fatal cases of COVID-19 in the world from 2020-01-02 to 2020-06-26. Microsoft product screen shot(s) reprinted with permission from Microsoft Corporation
PPGIS, VGI and Geo-social Media
Public participatory GIS (PPGIS) attempts to consider citizens’ knowledge into urban decision-making processes, disaster management, future planning, etc. Usually, PPGIS is used by administrators to encourage the participation of citizens in urban and public decision-making [65–68]. Involving the spatial dimension in the PPGIS increases the accuracy and validity of urban problems significantly [69, 70]. Volunteered Geographic Information (VGI) is a technique for individual volunteers to disseminate spatial and geographic data [71]. It could offer a reasonable prospect for collecting COVID-19 outbreak data. VGI was presented by Goodchild [71], as user-generated geographical data and information formed to help managers, treatment staff, citizens, and urban planners. The term VGI was introduced to highlight user inputs, e.g., geotags and coordinates in the web-based mapping [71]. As stated by Goodchild and Li [72], VGI comprises of a form of crowdsourcing data that usually include georeferenced point and line data types, attached by a brief text-based explanation, pictures, or even videotapes. Crowdsourcing appears to be an operative approach for gathering reliable geographical data for different domains and applications in which people are utilized as “sensors” [72].
Another approach for implementing PPGIS is geosocial media that enables users to compose and post short statements about their perceptions and/or experiences with geolocations, which plays an increasingly important role in our daily lives [73]. The location provides a strong tie between social networking and GIS. It is significant to understand the location data of people and provide location-based services to users by integrating spatial analysis capabilities and social networks [74, 75].
Both VGI and geosocial media are promising infrastructures for COVID-19 data gathering. Different kinds of data could be achieved via these platforms as depicted in Fig. 8.
Fig. 8.
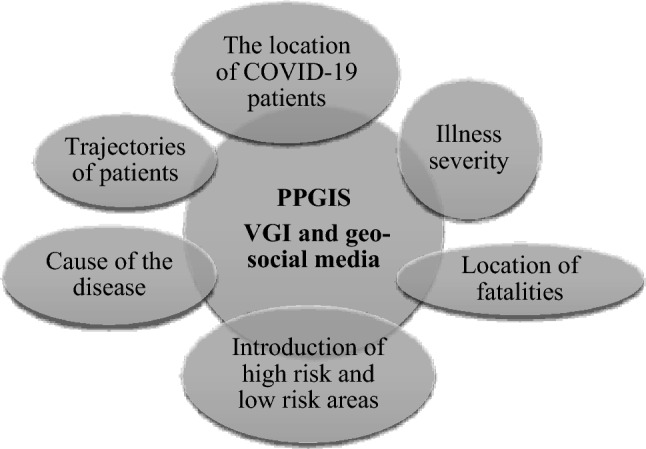
Different applications of PPGIS, VGI and geo-social media in COVID-19 outbreak
As seen in Fig. 8, the location information of COVID-19 patients, the illness severity, the cause of the disease (direct contact, going to a high-risk area, …), trajectories of patients, the location information of fatalities and introduction of high risk and low-risk areas could be collected toward PPGIS using VGI and geosocial networks.
SDSS
Spatial decision support systems (SDSS) combine spatial and non-spatial data, the analysis and visualization functions GIS, and decision models in specific domains, to compute the characteristics of problem solutions, facilitate the evaluation of solution alternatives, and the assessment of their trade-offs [75]. The decision problems in SDSS are typically characterized by a combination of spatial and non-spatial characteristics, with the former recording a location's geographic coordinates and spatial relations (i.e., proximity, overlap, containment, distribution pattern). Usually, SDSSs use multi-criteria decision-making analysis [75–78]. SDS could be efficient in caregiving, scheduling the routes, prioritization of health-care services and hospitals, risk assessment, zoning of more prone areas to diseases, detection of hot spots and cold spots [79–81]. Different MCDM methods such as analytical hierarchical process (AHP), analytical network process (ANP), ELimination Et Choice Translating REality (ELECTRE), Technique for Order of Preference by Similarity to Ideal Solution (TOPSIS), Preference Ranking Organization METHod for Enrichment of Evaluations (PROMETHEE) and Vise Kriterijumska Optimizacija I Kompromisno Resenje (VIKOR) have different efficiency and pertinence depending on the problem of examination. A comparative analysis of various MCDM methods has been given in several pieces of literature. AHP and ANP used pair-wise comparisons of alternatives between criteria and sub-criteria [82, 83]. ANP is regularly applied whensoever there is some sort of interdependences amongst the criteria or sub-criteria; while AHP considers all the criteria and sub-criteria independently [84]. The ELECTRE technique is usually measured more appropriately for problems having not many criteria and several alternatives [85]. PROMETHEE is a ranking practice comparable with ELECTRE as it similarly contains multiple repetitions and it is easy to use [86]. The main profit of the VIKOR technique is that it uses the multi-criteria grade index based on the particular measure of ‘‘closeness’’ to the ideal solution [87]. Because of its advantages, the use of the VIKOR method has been enhanced in the recent past including green supplier selection [88], evaluating service quality in the air industry [38], military airport location selection [89], industrial robots’ selection [90] and much more. All these spatial decision-making methods have been used in COVID-19 outbreak control [91–93].
Satellite Imagery
Satellite remote sensing nowadays became a very powerful tool for estimating different parameters such as land surface temperature [94], total atmospheric water vapor content, global solar radiation, land surface, and also near-surface air temperature emissivity [95, 96]. Since the relations between the COVID-19 outbreak and the environmental factors haven’t been completely considered yet, the environmental effects of COVID-19 according to the lockdown strategies and changing of human activities in different countries should be investigated. In this regard, satellite imageries are an important data source that could produce environmental data layers to analyze via GIS modeling. From the beginning of the COVID-19 outbreak on 31 December 2019, several studies focused on this domain. For example, a significant reduction in nitrogen dioxide (NO2) emissions before and after lockdown (up to 20–30%) were observed in China by analyzing the satellite imagery captured by European Space Agency (ESA) satellite Sentinel-5P using TROPOMI Instrument, and [97]. Similar results were reached for the reduction in NO2 emissions in Spain, France, Italy, and the USA before and after lockdown using the same method [97]. Figure 9 displays a notable reduction of NO2 in China before lockdown (Jan 6–19, 2020) and after lockdown (Feb 3–16, 2020).
Fig. 9.
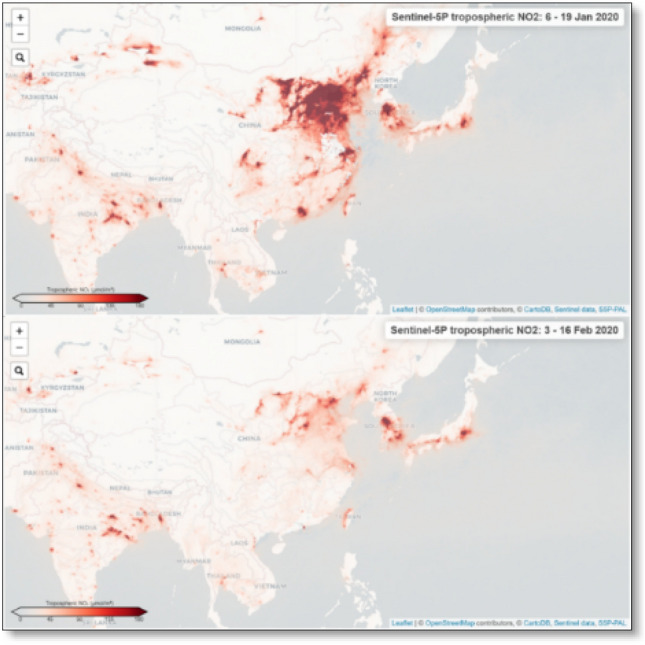
NO2 emissions in China before lockdown (Jan 6–19, 2020) and after lockdown (Feb 3–16, 2020). (Data source: ESA Copernicus Sentinel-5P Mapping Portal, 2020, doi: https://www.esa.int/Applications/Observing_the_Earth/Copernicus/Sentinel-5P)
An image-based analysis was carried out on air pollution changes in India after lockdown, with results showing that the concentration of PM2.5 has reduced in one month especially in the Northern and eastern states including the capital New Delhi (the hotspot of air pollution) [24].
Another study mapped global temperature and absolute humidity during a COVID-19 outbreak (January-March 2020) using ERA-5 reanalysis data [98]. The study discovered that temperate areas with temperatures ranging from around 2 to 21 °C appeared to possess a higher risk of COVID spreads, although the intensity of COVID-19 spread is not uniform across the globe. In recent months and weeks, more COVID-19 cases were reported from Europe and North America (e.g., U.S.) with more rapid human-to-human transmission [98].
Medical Waste Collection (MSW) Strategies and Vehicle Routing Problem (VRP)
Solid waste management, especially medical solid waste collection and transportation, has become a major concern in large urban areas. The existing waste management systems incur a huge cost for collecting and hauling, e.g., accounting for almost 50–70% of the total cost [54, 99]. The medical waste should be collected, transported, and disposed of in a minimal time directly from hospitals and medical centers to disposal sites, via safe and conservative methods. The necessity of optimal waste collection and transportation will be intensified when encountered with medical and infectious wastes: they contain potentially dangerous micro-organisms that may infect medical center patients, staff, public, and the environment [46, 55]
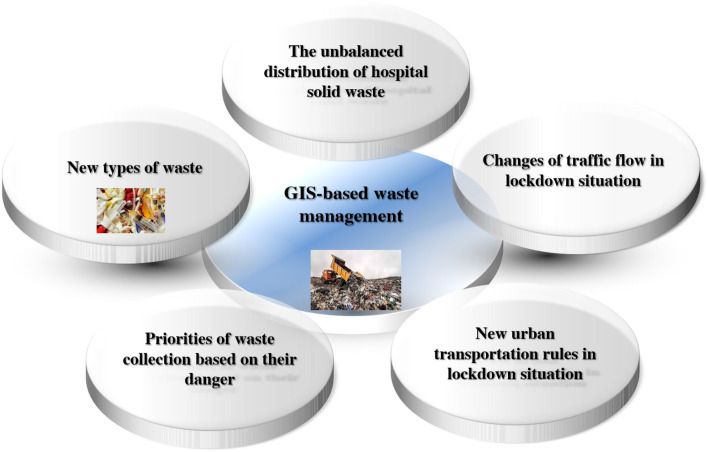
The crisis brought upon by the COVID-19 pandemic has impacted waste generation on a global scale and the unexpected fluctuations in waste composition and quantity also require a dynamic response from policymakers [83]. There was a sudden demand on medical supplies like masks and hand sanitizers with a fast and widespread of COVID-19 across the continents, with estimated amounts of 89 million medical masks and 76 million examination gloves needed for COVID-19 protection and treatment every month according to the WHO Coronavirus Disease (COVID-19) Dashboard (accessed on July 18, 2020). Due to the coronavirus-contaminated waste, as well as the need for rapid and efficient collection and disposal of waste, it is necessary to provide new solutions. Also, in the COVID-19 outbreak, the volumes of waste are increased because of masks and sanitizers which may be varied locationally. So, we encounter a new type of VRP which is the base procedure in waste collection and transportation and it is one of the fundamental problems that could be solved using a GIS-based approach [54, 99]. Figure 10 shows some new problems which lead to improving the new method to manage the new types of waste that are distributed in urban are unbalanced.
Fig. 10.
New problems in waste management need to use a new GIS-based method
Geo-business
The COVID-19 outbreak has meaningfully impacted the economic situation of the world moreover its impacts are more severe in some countries. Some small and medium businesses have been destroyed because there are many interruptions in their everyday activities, also the restricted class of available clienteles. The rate of joblessness enlarged whereas the economic development reduced quickly. The beginning of COVID-19 and the following reduction of these small initiatives have significantly affected the economy because of socio-economic lockdown [100–102]. COVID-19 is mostly related to the location, so considering the concept of geospatial business or geo-business will help the business managers to introduce new business approaches to decrease the COVID-19 outbreak [101, 103]. In this regard, innovating geo-startups and new digital geo-marketing approaches could facilitate the business in the new situation of the world. One of the main industries which have been affected by COVID-19 is tourism [104]. This slowdown for the industry may set millions of occupations at risk, thus intimidating to roll back the growth made on the front of supportable development goals [1]. In this regard, improving the new platform for tourism management due to the novel location-based protocols could enhance the industry. Promoting different location-based strategies for banning and restricting some jobs could decrease the awful effects of lockdown also in high-risk regions despite banning all the businesses [105, 106].
Context-Aware Recommendation Systems
Efforts have been made to describe the context for operational use [107–111]. According to Abowd’s definition, context is any information for describing an entity or object [94]. Although important characteristics were given in Abowd’s definition of context, it is still challenge to quickly determine what information should be considered as context [107].
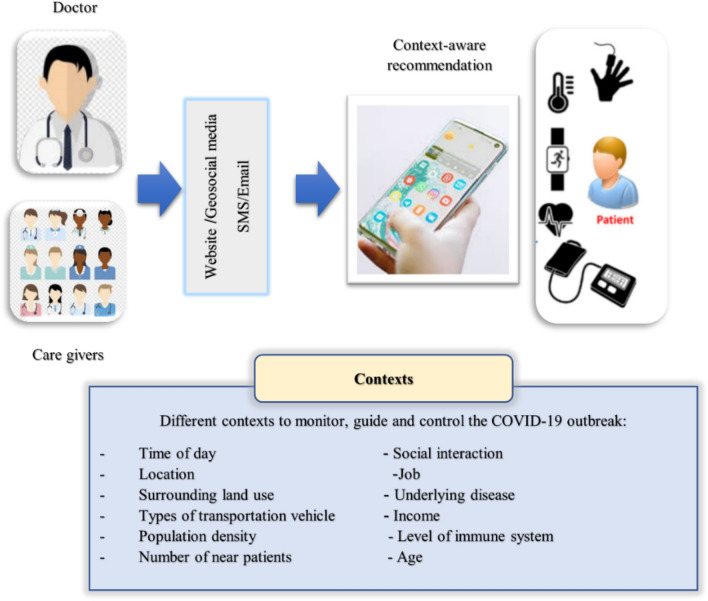
Efforts have been made to describe the context for operational use [53, 107, 109]. According to Abowd’s definition, context is any information for describing an entity or object (Abowd et al. [108]). Although important characteristics were given in Abowd’s definition of context, it is still a challenge to quickly determine what information should be considered as context [108]. Context-aware systems should sense context and adapt to context [110, 111]. Usually, in healthcare services, the contexts are static and dynamic. The static contexts are the location of patients’ homes, their job, and gender. Dynamic contexts can be defined as air pollution, patients’ activities, mode of transportation, weather, and time. For example, the context should be able to be observed and manipulated as needed, such as the GPS coordinates [112]. Ubiquitous or pervasive healthcare (U-Healthcare) signifies one of the key pervasive computing applications that provides several services; includes monitoring health and patient’s wellbeing anytime and anywhere employing smart technologies. These provide safely life for patients and help to live independently in their homes. To achieve these goals, the context-aware systems should learn over time, and respond quickly even if they encounter a new situation in which behavioral adaptation is required. Figure 11 shows a context-aware architecture for adapting the needs of patients, doctors, and caregivers.
Fig. 11.
A context-aware architecture for adapting the needs of patients, doctors, and caregivers.
Adapted from Esposito et al. [114]
As seen in Fig. 11, different context-aware recommendations will be provided for users in different situations. Context-aware recommendation systems could be efficient for controlling COVID-19 incidence in two ways: (1) providing context-aware alarming for healthy people to keep social distance with patients in daily activities. In context-aware systems, the types of services are adapted according to the different contexts. The contexts may be static (population density, surrounding land use, level of the immune system, income for an individual) or dynamic (location, time of day, social interaction, and the number of near patients) [15]. Therefore, context-aware services should be provided to minimize the interaction with high-risk areas and patients, (2) helping the patients who should be stayed at home. Being at home is necessary for COVID-19 patients. They should receive caregivers’ services according to the disease level, age, affordance, and needed requirements [113–115]. Also, some medical services should be provided directly for them, which should consider their location, also the surrounding contexts.
IoT
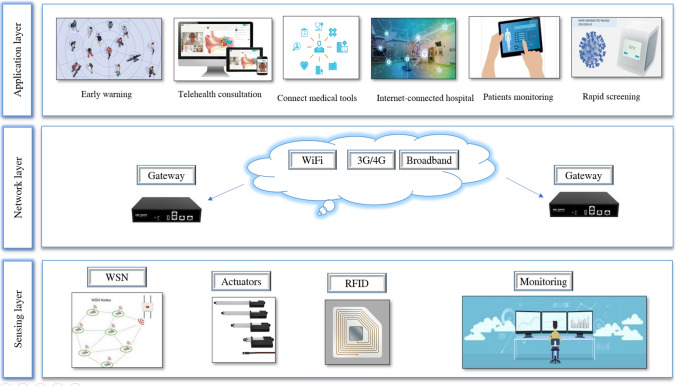
The Internet of Things (IoT) is a mode involving mechanical equipment and computation capability and being able to transfer data on the network without human involvements (Singh et al. [116]). IoT can be used as an innovative technique to monitor the COVID-19 pandemic by capturing the real-time COVID-19 surveillance data and other relevant information, especially during the lockdown [116–118]. Figure 12 shows the typical processes applied by IoT for monitoring COVID-19.
Fig. 12.
Applications which could be achieved by designing IoT
Telehealth facilities based on IoT has a significant role in the COVID-19 outbreak. A portal is formed where patients interrelate with the physicians and the treatment is conducted remotely. The advantage of using an IoT system in COVID-19 is that the doctors do not need direct contact with the patients, consequently preventing the propagation of the virus [119]. Numerous nations have begun to innovate new treatment facilities using IoT for digital telehealth. Health Arc [31] offers health care strategies based on IoT to the patients whose data is observed continuously under medical supervision. Continuous Care [120], Health Net Connect [121] and Sehatyab [122] are amongst the IoT-based telehealth monitoring systems. Utilizing these tools, patients are timely directed by avoiding virus spread. Besides, it correspondingly assists to decline the counts for hospitalizations and readmissions, which help in refining the superiority of life and offers appropriate dealing to COVID-19 patients [117].
As seen, IoT technology includes devices and objects such as radio-frequency identifications (RFID) tags, Pcameras, various sensors, and smart assistants that aid in efficient completion of tasks. The interconnected nature of IoT devices provides an environment to streamline tasks, reduce workload, and minimize the impact on the end-user [123].
Although IoT-based approaches have many advantages such as accuracy of data, on-time treatment, timely diagnosis, information of safety measure, high demand, and accurate forecasting, there are some challenges in implementing these types of facilities include scalability of IoT devices, high bandwidth requirements, security and privacy issues, and big data centers [119]
Conclusions
This paper aims to introduce all aspects of geospatial services, especially modern technology in tracking and monitoring the COVID-19 pandemic. The study proposes ten classes of geospatial solutions including spatio-temporal analysis, SDSS approaches, geo-business, context-aware recommendation systems, participatory GIS and VGI, IoT, LBS, web mapping, satellite imagery-based analysis, and waste management. These approaches have been assessed according to our investigations on Science Direct, Springer, ResearchGate, and Google Scholar about controlling pandemic and epidemic diseases in the world. The main category of articles is related to spatio-temporal analysis, while the least research is related to IoT-based approaches. This proportion has been held on surveying GIS-based solutions for preventing and controlling COVID-19. The amount of spatio-temporal analysis is significantly more rather than the others. But as we investigated, the new progress on internet-based technologies, improvement of wireless communications, and increasing the practice of these equipment remind the increasing usage of web mapping and IoT-based services for social distancing in COVID-19.
It seems that the reason for the extensive use of spatio-temporal models in COVID-19 is that they can partially clarify the geographic disparities in this outbreak. Also, spatio-temporal models such as regression, GWR, agent-based models, data mining, and machine learning approaches can derive the spatial, geographical, and temporal relations between the intensity of COVID-19 outbreak and any environmental, socio-demographic, and infrastructural characteristics. Correspondingly, according to the dynamic characteristic of COVID-19 prevalence, web-mapping with different scales is a suitable strategy for stating the spatio-temporal propagation of new cases, confirmed cases, recovered patients, and deaths as it has been done by WHO during the COVID-19 pandemic. Besides, IoT has a key role in reducing the risks of coronavirus spread by providing platforms that support the WHO protocols of social distancing in daily activities. On the other hand, providing location-based services along with the internet could improve urban activities to control the COVID-19 outbreak. Integrating the context-aware concepts in location-based services will personalize the spatial services for the people.
The PPGIS, VGI, and geo-social media are the other solutions that could enhance the data gathering process especially the patients’ position, the disease intensity of individuals, and the people movement patterns. As a certain knowledge about the involving factors on COVID-19 prevalence is not existed until now, so it is not reasonable to use the SDSS framework in this case. Hence, it is suggested to apply the data-driven or explicit knowledge for making better decisions based on MCDA. Regarding the satellite imagery, the environmental changes of temperature, different kinds of pollutions, humidity, soil moisture, and other environmental characteristics could be monitored and assessed using remotely-sensed data. Also, the surveys concluded that some new paradigms for providing geospatial services are raised in this situation especially in geo-business, waste management, and health-care facilities. It means that in these categories which are related to all people, the government should afford new GIS-based facilities while considering ‘social distancing’ and ‘indirect contact’.
Declarations
Conflict of Interest
The authors declare that they have no conflict of interest.
Footnotes
Publisher's Note
Springer Nature remains neutral with regard to jurisdictional claims in published maps and institutional affiliations.
Contributor Information
Najmeh Neysani Samany, Email: nneysani@ut.ac.ir.
Hua Liu, Email: HXLiu@odu.edu.
Reza Aghataher, Email: reza_aghataher@yahoo.com.
Mohammad Bayat, Email: m.bayat9312@gmail.com.
References
- 1.World tourism organization (2020). [Press Release—7 May 2020]. Retrieved July 22, 2020, from https://www.unwto.org/news/covid-19-international-tourist-numbers-could-fall-60-80-in-2020.
- 2.Zhang H, Shaw R. Identifying research trends and gaps in the context of COVID-19. Int J Environ Res Public Health. 2020;2020:17. doi: 10.3390/ijerph17103370. [DOI] [PMC free article] [PubMed] [Google Scholar]
- 3.Waller LA, Carol A, Gotway (2020) Applied spatial statistics for public health data. 2004, pp. 368.
- 4.Gosoniu L, Msengwa A, Lengeler C, Vounatsou P. Spatially explicit burden estimates of malaria in Tanzania: bayesian geostatistical modeling of the malaria indicator survey data. PLoS ONE. 2012;7:e23966. doi: 10.1371/journal.pone.0023966. [DOI] [PMC free article] [PubMed] [Google Scholar]
- 5.Mathur M. Spatial autocorrelation analysis in plant population: an overview. J Appl and Nat Sci. 2015;7:501–513. [Google Scholar]
- 6.Ren Z, Wang D, Ma A, Hwang J, Bennett A, Sturrock HJ, Fan J, Zhang W, Yang D, Feng X, et al. Predicting malaria vector distribution under climate change scenarios in China: challenges for malaria elimination. Sci Rep. 2016;6:20604. doi: 10.1038/srep20604. [DOI] [PMC free article] [PubMed] [Google Scholar]
- 7.Zambrano LI, Sierra M, Lara B, Rodriguez-Nunez I, Medina MT, Lozada-Riascos CO, Rodriguez-Morales AJ. Estimating and mapping the incidence of dengue and chikungunya in Honduras during 2015 using Geographic Information Systems (GIS) J Infect Public Health 2017. 2015;10:446–456. doi: 10.1016/j.jiph.2016.08.003. [DOI] [PubMed] [Google Scholar]
- 8.Musso D, Rodriguez-Morales AJ, Levi JE, Cao-Lormeau VM, Gubler DJ. Unexpected outbreaks of arbovirus infections: lessons learned from the Pacific and tropical America. Lancet Infect Dis. 2018;18:e355–e361. doi: 10.1016/S1473-3099(18)30269-X. [DOI] [PubMed] [Google Scholar]
- 9.Sarwar S, Waheed R, Sarwar S, Khan A. COVID-19 challenges to Pakistan: Is GIS analysis useful to draw solutions? Sci Total Environ. 2020;2020(73015):139089. doi: 10.1016/j.scitotenv.2020.139089. [DOI] [PMC free article] [PubMed] [Google Scholar]
- 10.Foughali K, Fathallah K, Frihida A. Using cloud IOT for disease prevention in precision agriculture. Procedia Computr Sci. 2018;130:575–582. doi: 10.1016/j.procs.2018.04.106. [DOI] [Google Scholar]
- 11.Vianna HD, Barbosa JLV. A scalable model for building context-aware applications for noncommunicable diseases prevention. Inf Process Lett. 2019;148:1–6. doi: 10.1016/j.ipl.2019.03.010. [DOI] [Google Scholar]
- 12.Al-Makhadmeh Z, Tolba A. Utilizing IoT wearable medical device for heart disease prediction using higher order Boltzmann model: a classification approach. Measurement. 2019;147:106815. doi: 10.1016/j.measurement.2019.07.043. [DOI] [Google Scholar]
- 13.Stacey CL, Pai M, Novisky MA, Radwany SM. Revisiting ‘awareness contexts' in the 21st century hospital: how fragmented and specialized care shape patients’ awareness of dying. Soc Sci Med. 2019;220:212–218. doi: 10.1016/j.socscimed.2018.10.028. [DOI] [PubMed] [Google Scholar]
- 14.Yashodha G, Shalini D. An integrated approach for predicting and broadcasting tea leaf disease at early stage using IoT with machine learning—a review. Mater Today: Proc. 2020 doi: 10.1016/j.matpr.2020.05.458. [DOI] [Google Scholar]
- 15.Ghose B, Rehen Z. Third international conference on computing and network communications (CoCoNet’19) a mechanism for air health monitoring in smart city using context aware computing. Procedia Comput Sci. 2020;171:2512–2521. doi: 10.1016/j.procs.2020.04.272. [DOI] [Google Scholar]
- 16.Huang H, Wang Yi, Wang Z, Liang Z, Qu S,Ma S, Mao G, Liu X (2020) Epidemic Features and Control of 2019 Novel Coronavirus Pneumonia in Wenzhou, China. The Lancet Global Health. 28.
- 17.Giuliani D, Dickson MM, Espa G, Santi F (2020) Modelling and predicting the spatio-temporal spread of Coronavirus disease 2019 (COVID-19) in Italy. In arXiv. [DOI] [PMC free article] [PubMed]
- 18.Cordes J, Castro MC. Spatial analysis of COVID-19 clusters and contextual factors in New York City. Spat Spatiotemporal Epidemiol. 2020;34:100355. doi: 10.1016/j.sste.2020.100355. [DOI] [PMC free article] [PubMed] [Google Scholar]
- 19.Mbunge E. Effects of COVID-19 in South African health system and society: an explanatory study. Diabetes Metab Syndr. 2020;14:1809–1814. doi: 10.1016/j.dsx.2020.09.016. [DOI] [PMC free article] [PubMed] [Google Scholar]
- 20.Cuevas E. An agent-based model to evaluate the COVID-19 transmission risks in facilities. Comput Biol Med. 2020;121:103827. doi: 10.1016/j.compbiomed.2020.103827. [DOI] [PMC free article] [PubMed] [Google Scholar]
- 21.Briz-Redon A, Serrano-Aroca A. A spatio-temporal analysis for exploring the effect of temperature on COVID-19 early evolution in Spain. Sci Total Environ. 2020;728:138811. doi: 10.1016/j.scitotenv.2020.138811. [DOI] [PMC free article] [PubMed] [Google Scholar]
- 22.Kerimray A, Baimatova N, Ibragimova OP, Bukenov B, Kenessov B, Plotitsyn P, Karaca F. Assessing air quality changes in large cities during COVID-19 lockdowns: the impacts of traffic-free urban conditions in Almaty, Kazakhstan. Sci Total Environ. 2020;730:139179. doi: 10.1016/j.scitotenv.2020.139179. [DOI] [PMC free article] [PubMed] [Google Scholar]
- 23.Laxmipriya S, Narayanan RM. COVID-19 and its relationship to particulate matter pollution–Case study from part of greater Chennai, India. Mater Today: Proc. 2020 doi: 10.1016/j.matpr.2020.09.768. [DOI] [PMC free article] [PubMed] [Google Scholar]
- 24.Lokhandwala S, Gautam P. Indirect impact of COVID-19 on environment: a brief study in Indian context. Environ Res. 2020;188:109807. doi: 10.1016/j.envres.2020.109807. [DOI] [PMC free article] [PubMed] [Google Scholar]
- 25.Martorell-Marugan J, Villatoro-Garcia JA, Garcia-Moreno A, Lopez-Dominguez R, Requena F, Merelo JJ, Lacasana M, de Dios Luna J, Diaz-Mochon JJ, Lorente JA, et al. DatAC: a visual analytics platform to explore climate and air quality indicators associated with the COVID-19 pandemic in Spain. Sci Total Environ. 2021;750:141424. doi: 10.1016/j.scitotenv.2020.141424. [DOI] [PMC free article] [PubMed] [Google Scholar]
- 26.Rahman MS, Azad MAK, Hasanuzzaman M, Salam R, Islam A, Rahman MM, Hoque MMM. How air quality and COVID-19 transmission change under different lockdown scenarios? a case from Dhaka city. Bangladesh Sci Total Environ. 2021;762:143161. doi: 10.1016/j.scitotenv.2020.143161. [DOI] [PMC free article] [PubMed] [Google Scholar]
- 27.Alkhamis MA, Al Youha S, Khajah MM, Ben Haider N, Alhardan S, Nabeel A, Al Mazeedi S, Al-Sabah SK. Spatiotemporal dynamics of the COVID-19 pandemic in the State of Kuwait. Int J Infect Dis. 2020;98:153–160. doi: 10.1016/j.ijid.2020.06.078. [DOI] [PMC free article] [PubMed] [Google Scholar]
- 28.Aherfi S, Gautret P, Chaudet H, Raoult D, La Scola B. Clusters of COVID-19 associated with Purim celebration in the Jewish community in Marseille, France, March 2020. Int J Infect Dis. 2020;100:88–94. doi: 10.1016/j.ijid.2020.08.049. [DOI] [PMC free article] [PubMed] [Google Scholar]
- 29.Gao S, Rao J, Kang Y, Liang Y, Kruse J, Dopfer D, Sethi AK, Mandujano Reyes JF, Yandell BS, Patz JA. Association of mobile phone location data indications of travel and stay-at-Home mandates with COVID-19 infection rates in the US. JAMA Netw Open. 2020;3:e2020485. doi: 10.1001/jamanetworkopen.2020.20485. [DOI] [PMC free article] [PubMed] [Google Scholar]
- 30.Luo W, Majumder M, Liu D, Poirier C, Mandl K, Lipsitch M, Santillana M (2020) The role of absolute humidity on transmission rates of the COVID-19 outbreak. MedRxiv 2020. [DOI] [PMC free article] [PubMed]
- 31.Allam Z, Jones DS. On the Coronavirus (COVID-19) outbreak and the smart city network: universal data sharing standards coupled with artificial intelligence (AI) to benefit urban health monitoring and management. Healthcare (Basel) 2020 doi: 10.3390/healthcare8010046. [DOI] [PMC free article] [PubMed] [Google Scholar]
- 32.Sangiorgio V, Parisi F. A multicriteria approach for risk assessment of Covid-19 in urban district lockdown. Saf Sci. 2020;130:104862. doi: 10.1016/j.ssci.2020.104862. [DOI] [PMC free article] [PubMed] [Google Scholar]
- 33.Bogoch II, Watts A, Thomas-Bachli A, Huber C, Kraemer MUG, Khan K. Potential for the global spread of a novel coronavirus from China. J Travel Med. 2020 doi: 10.1093/jtm/taaa011. [DOI] [PMC free article] [PubMed] [Google Scholar]
- 34.Zhou C, Su F, Pei T, Zhang A, Du Y, Luo B, Xiao H. COVID-19: challenges to GIS with big data. Geogr Sustain. 2020;1:77–87. [Google Scholar]
- 35.Kang D, Choi H, Kim JH, Choi J. Spatial epidemic dynamics of the COVID-19 outbreak in China. Int J Infect Dis. 2020;94:96–102. doi: 10.1016/j.ijid.2020.03.076. [DOI] [PMC free article] [PubMed] [Google Scholar]
- 36.Chan HF, Skali A, Torgler B (2020) A global dataset of human mobility (No. 2020-04). CREMA Working Paper.
- 37.Tosepu R, Gunawan J, Effendy DS, Ahmad LAI, Lestari H, Bahar H, Asfian P. Correlation between weather and Covid-19 pandemic in Jakarta, Indonesia. Sci Total Environ. 2020;725:138436. doi: 10.1016/j.scitotenv.2020.138436. [DOI] [PMC free article] [PubMed] [Google Scholar]
- 38.Gupta S, Raghuwanshi GS, Chanda A. Effect of weather on COVID-19 spread in the US: a prediction model for India in 2020. Sci Total Environ. 2020;728:138860. doi: 10.1016/j.scitotenv.2020.138860. [DOI] [PMC free article] [PubMed] [Google Scholar]
- 39.Allcott H, Boxell L, Conway J, Gentzkow M, Thaler M, Yang D. Polarization and public health: partisan differences in social distancing during the coronavirus pandemic. J Public Econ. 2020;191:104254. doi: 10.1016/j.jpubeco.2020.104254. [DOI] [PMC free article] [PubMed] [Google Scholar]
- 40.Velásquez RMA, Lara JVM. Forecast and evaluation of COVID-19 spreading in USA with reduced-space Gaussian process regression. Chaos, Solitons Fractals. 2020;136:109924. doi: 10.1016/j.chaos.2020.109924. [DOI] [PMC free article] [PubMed] [Google Scholar]
- 41.Franch-Pardo I, Napoletano BM, Rosete-Verges F, Billa L. Spatial analysis and GIS in the study of COVID-19. A review. Sci Total Environ. 2020;739:140033. doi: 10.1016/j.scitotenv.2020.140033. [DOI] [PMC free article] [PubMed] [Google Scholar]
- 42.Jin L, Zhao Y, Zhou J, Tao M, Yang Y, Wang X, Yuan H. Distributions of time, place, and population of novel coronavirus disease 2019 (COVID-19) from January 20to February 10, 2020, in China. Rev Clín Esp (English Ed) 2020;220:495–500. doi: 10.1016/j.rce.2020.04.001. [DOI] [PMC free article] [PubMed] [Google Scholar]
- 43.Pourghasemi HR, Pouyan S, Heidari B, Farajzadeh Z, Shamsi SRF, Babaei S, Khosravi R, Etemadi M, Ghanbarian G, Farhadi A. Spatial modeling, risk mapping, change detection, and outbreak trend analysis of coronavirus (COVID-19) in Iran (days between February 19 and June 14, 2020) Int J Infect Dis. 2020;98:90–108. doi: 10.1016/j.ijid.2020.06.058. [DOI] [PMC free article] [PubMed] [Google Scholar]
- 44.Chatterjee R, Bajwa S, Dwivedi D, Kanji R, Ahammed M, Shaw R. COVID-19 risk assessment tool: dual application of risk communication and risk governance. Progress Disaster Sci. 2020;7:100109. doi: 10.1016/j.pdisas.2020.100109. [DOI] [PMC free article] [PubMed] [Google Scholar]
- 45.Karaye IM, Horney JA. The impact of social vulnerability on COVID-19 in the U.S.: an analysis of spatially varying relationships. Am J Prev Med. 2020;59:317–325. doi: 10.1016/j.amepre.2020.06.006. [DOI] [PMC free article] [PubMed] [Google Scholar]
- 46.Kulkarni BN, Anantharama V. Repercussions of COVID-19 pandemic on municipal solid waste management: challenges and opportunities. Sci Total Environ. 2020;743:140693. doi: 10.1016/j.scitotenv.2020.140693. [DOI] [PMC free article] [PubMed] [Google Scholar]
- 47.Sannigrahi S, Pilla F, Basu B, Basu AS, Molter A. Examining the association between socio-demographic composition and COVID-19 fatalities in the European region using spatial regression approach. Sustain Cities Soc. 2020;62:102418. doi: 10.1016/j.scs.2020.102418. [DOI] [PMC free article] [PubMed] [Google Scholar]
- 48.O.G.C. (2009) Open location services 1.1.
- 49.Basiri A, Lohan ES, Moore T, Winstanley A, Peltola P, Hill C, Amirian P, Silva PFE. Indoor location-based services challenges, requirements and usability of current solutions. Comput Sci Rev. 2017;24:1–12. doi: 10.1016/j.cosrev.2017.03.002. [DOI] [Google Scholar]
- 50.Schmidtke HR. Location-aware systems or location-based services: a survey with applications to CoViD-19 contact tracking. J Reliab Intell Environ. 2020 doi: 10.1007/s40860-020-00111-4. [DOI] [PMC free article] [PubMed] [Google Scholar]
- 51.Nguyen KA, Luo ZY, Watkins C. Epidemic contact tracing with smartphone sensors. J Locat-Based Serv. 2020;14:92–128. doi: 10.1080/17489725.2020.1805521. [DOI] [Google Scholar]
- 52.Leith DJ, Farrell S (2020) GAEN due diligence: verifying the google/apple Covid exposure notification API. In: CoronaDef21, Proceedings of NDSS ‘21 2021, 2020; pp 1–8.
- 53.Wang S, Ding S, Xiong L. A new system for surveillance and digital contact tracing for covid-19: spatiotemporal reporting over network and GPS. JMIR Mhealth Uhealth. 2020;8:19457. doi: 10.2196/19457. [DOI] [PMC free article] [PubMed] [Google Scholar]
- 54.Samany NN, Sheybani M, Zlatanova S. Detection of safe areas in flood as emergency evacuation stations using modified particle swarm optimization with local search. Applied Soft Computing. 2021;111:107681. doi: 10.1016/j.asoc.2021.107681. [DOI] [Google Scholar]
- 55.Yang L, Yu X, Wu X, Wang J, Yan X, Jiang S, Chen Z. Emergency response to the explosive growth of health care wastes during COVID-19 pandemic in Wuhan, China. Resour Conserv Recycl. 2020;164:105074. doi: 10.1016/j.resconrec.2020.105074. [DOI] [PMC free article] [PubMed] [Google Scholar]
- 56.Alballa N, Al-Turaiki I. Machine learning approaches in COVID-19 diagnosis, 405 mortality, and severity risk prediction: a review. Inf Med Unlocked. 2021;24:100564. doi: 10.1016/j.imu.2021.100564. [DOI] [PMC free article] [PubMed] [Google Scholar]
- 57.Georgieva I, Beaunoyer E, Guitton MJ. Ensuring social acceptability of technological tracking in the COVID-19 context. Comput Hum Behav. 2021;116:106639. doi: 10.1016/j.chb.2020.106639. [DOI] [Google Scholar]
- 58.Smidt HJ, Jokonya O. The challenge of privacy and security when using technology to track people in times of COVID-19 pandemic. Procedia Comput Sci. 2021;181:1018–1026. doi: 10.1016/j.procs.2021.01.281. [DOI] [PMC free article] [PubMed] [Google Scholar]
- 59.Hu B, Qiu J, Chen H, Tao V, Wang J, Lin H. First, second and potential third generation spreads of the COVID-19 epidemic in mainland China: an early exploratory study incorporating location-based service data of mobile devices. Int J Infect Dis. 2020;96:489–495. doi: 10.1016/j.ijid.2020.05.048. [DOI] [PMC free article] [PubMed] [Google Scholar]
- 60.Schmidtke HR. Location-aware systems or location-based services: a survey with applications to CoViD-19 contact tracking. J Reliable Intell Environ. 2020;6:191–214. doi: 10.1007/s40860-020-00111-4. [DOI] [PMC free article] [PubMed] [Google Scholar]
- 61.Neumann A. Web mapping and web cartography. Springer Handb Geograp Inf. 2012 doi: 10.1007/978-3-540-72680-7_14. [DOI] [Google Scholar]
- 62.Veenendaal B, Brovelli MA, Li S. Review of web mapping: eras, trends and directions. ISPRS Int J Geo Inf. 2017;6(10):317. doi: 10.3390/ijgi6100317. [DOI] [Google Scholar]
- 63.Mooney P, Juhász L. Mapping COVID-19: how web-based maps contribute to the infodemic. Dialogues Hum Geogr. 2020;10(2):265–270. doi: 10.1177/2043820620934926. [DOI] [Google Scholar]
- 64.Kamel Boulos MN, Geraghty EM. Geographical tracking and mapping of coronavirus disease COVID-19/severe acute respiratory syndrome coronavirus 2 (SARS-CoV-2) epidemic and associated events around the world: how 21st century GIS technologies are supporting the global fight against outbreaks and epidemics. Int J Health Geogr. 2020;19:8. doi: 10.1186/s12942-020-00202-8. [DOI] [PMC free article] [PubMed] [Google Scholar]
- 65.Malczewski J (1999) GIS and multicriteria decision analysis.
- 66.Sieber R. Public participation geographic information systems: a literature review and framework. Ann Assoc Am Geogr. 2006;96:491. doi: 10.1111/j.1467-8306.2006.00702.x. [DOI] [Google Scholar]
- 67.Mansourian A, Taleai M, Fasihi A. A web-based spatial decision support system to enhance public participation in urban planning processes. J Spat Sci. 2011;56:269–282. doi: 10.1080/14498596.2011.623347. [DOI] [Google Scholar]
- 68.Fatehian S, Jelolchani-Niaraki M, Kakroodi AA, Dero QY, Samany NN. A volunteered geographic information system for managing environmental pollution of coastal zones: a case study in Nowshahr, Iran. Ocean Coastal Manag. 2018;163:54–65. doi: 10.1016/j.ocecoaman.2018.06.008. [DOI] [Google Scholar]
- 69.Neysani Samany N, Toomanian A, Maher A, Hanani Kh, Zali AR. The most places at risk surrounding the COVID-19 treatment hospitals in an urban environment- case study: Tehran city. Landuse policy. 2021;21:1–20. doi: 10.1016/j.landusepol.2021.105725. [DOI] [PMC free article] [PubMed] [Google Scholar]
- 70.Farnaghi M, Mansourian A. Blockchain, an enabling technology for transparent and accountable decentralized public participatory GIS. Cities. 2020;105:102850. doi: 10.1016/j.cities.2020.102850. [DOI] [Google Scholar]
- 71.Goodchild MF. Citizens as sensors: the world of volunteered geography. GeoJournal. 2007;69:211–221. doi: 10.1007/s10708-007-9111-y. [DOI] [Google Scholar]
- 72.Goodchild MF, Li L. Assuring the quality of volunteered geographic information: the nature and motivation of procedures. Spatial Stat. 2012;1:110–120. doi: 10.1016/j.spasta.2012.03.002. [DOI] [Google Scholar]
- 73.Kelley MJ. The emergent urban imaginaries of geosocial media. GeoJournal. 2013;78:181–203. doi: 10.1007/s10708-011-9439-1. [DOI] [Google Scholar]
- 74.Sui D, Goodchild M. The convergence of GIS and social media: challenges for GIScience. Int J Geogr Inf Sci. 2011;25:1737–1748. doi: 10.1080/13658816.2011.604636. [DOI] [Google Scholar]
- 75.Marsh K, Ijzerman M, Thokala P, Baltussen R, Boysen M, Kalo Z, Lonngren T, Mussen F, Peacock S, Watkins J, et al. Multiple criteria decision analysis for health care decision making-emerging good practices: report 2 of the ISPOR MCDA emerging good practices task force. Value Health. 2016;19:125–137. doi: 10.1016/j.jval.2015.12.016. [DOI] [PubMed] [Google Scholar]
- 76.Babashahi S. Pmu25 using multiple criteria decision analysis (Mcda) to create a priority list of chronic non-communicable diseases (Ncds) to guide health research spending. Value Health. 2019 doi: 10.1016/j.jval.2019.09.1644. [DOI] [Google Scholar]
- 77.Naghdizadegan Jahromi M, Gomeh Z, Busico G, Barzegar R, et al. Developing a SINTACS-based method to map groundwater multi-pollutant vulnerability using evolutionary algorithms. Environ Sci Pollut Res, 2021;28:7854–69. 10.1007/s11356-020-11089-0. [DOI] [PubMed]
- 78.Morente-Molinera JA, Wu X, Morfeq A, Al-Hmouz R, Herrera-Viedma E. A novel multi-criteria group decision-making method for heterogeneous and dynamic contexts using multi-granular fuzzy linguistic modelling and consensus measures. Inf Fusion. 2020;53:240–250. doi: 10.1016/j.inffus.2019.06.028. [DOI] [Google Scholar]
- 79.Asadi Y, Neysani Samany N and Ezimand K. Seismic vulnerability assessment of urban buildings and traffic networks using fuzzy ordered weighted average. J. Mt. Sci. 2019;16:677–88. 10.1007/s11629-017-4802-4
- 80.Gouglas D, Marsh K. Prioritizing investments in new vaccines against epidemic infectious diseases: a multi-criteria decision analysis. J Multi-Criteria Decis Anal. 2019;26:153–163. doi: 10.1002/mcda.1683. [DOI] [Google Scholar]
- 81.Govindan K, Mina H, Alavi B. A decision support system for demand management in healthcare supply chains considering the epidemic outbreaks: a case study of coronavirus disease 2019 (COVID-19) Transp Res E Logist Transp Rev. 2020;138:101967. doi: 10.1016/j.tre.2020.101967. [DOI] [PMC free article] [PubMed] [Google Scholar]
- 82.Manupati VK, Ramkumar M, Baba V, Agarwal A. Selection of the best healthcare waste disposal techniques during and post COVID-19 pandemic era. J Clean Prod. 2021;281:121175. doi: 10.1016/j.jclepro.2020.125175. [DOI] [PMC free article] [PubMed] [Google Scholar]
- 83.Sharma HB, Vanapalli KR, Cheela VS, Ranjan VP, Jaglan AK, Dubey B, Bhattacharya J. Challenges, opportunities, and innovations for effective solid waste management during and post COVID-19 pandemic. Resour Conserv Recycl. 2020;162:105052. doi: 10.1016/j.resconrec.2020.105052. [DOI] [PMC free article] [PubMed] [Google Scholar]
- 84.Samanlioglu F, Erkan KB. Evaluation of the COVID-19 pandemic intervention strategies with hesitant F-AHP. J Healthcare Eng. 2020 doi: 10.1155/2020/8835258. [DOI] [PMC free article] [PubMed] [Google Scholar]
- 85.Konidari P, Mavrakis D. A multi-criteria evaluation method for climate change mitigation policy instruments. Energy Policy. 2007;35(12):6235–6257. doi: 10.1016/j.enpol.2007.07.007. [DOI] [Google Scholar]
- 86.Brans J, Vincke P. Note—a preference ranking organisation method: the PROMETHEE method for multiple criteria decision-making, mathematics. Manag Sci. 1985;31:647. doi: 10.1287/mnsc.31.6.647. [DOI] [Google Scholar]
- 87.Hezer S, Gelmez E, Özceylan E. Comparative analysis of TOPSIS, VIKOR and COPRAS methods for the COVID-19 regional safety assessment. J Infect Public Health. 2021;14(6):775–786. doi: 10.1016/j.jiph.2021.03.003. [DOI] [PMC free article] [PubMed] [Google Scholar]
- 88.Darvishi Boloorani A, Kiavarz M. Najmeh Neisany Samany, Lobat Zebardast, Mahdieh Zangiabadi. Spatial-temporal analysis of urban environmental quality of Tehran, Iran. s Mohammad Javanbakht, 2016;8(1):37. 10.3390/su8010037.
- 89.Sennaroglu B, Varlik CG. A military airport location selection by AHP integrated PROMETHEE and VIKOR methods. Transp Res Part D: Transp Environ. 2018;59:160–173. doi: 10.1016/j.trd.2017.12.022. [DOI] [Google Scholar]
- 90.Narayanamoorthy S, Geetha S, Rakkiyappan R, HoonJoob Y. Interval-valued intuitionistic hesitant fuzzy entropy based VIKOR method for industrial robots selection. Expert Syst Appl. 2019;121:28–37. doi: 10.1016/j.eswa.2018.12.015. [DOI] [Google Scholar]
- 91.Gao Z, Jiang Y, He J, Wu J, Xu J, Christakos G. An AHP-based regional COVID-19 vulnerability model and its application in China. Model Earth Syst Environ. 2021;28:1–14. doi: 10.1007/s40808-021-01244-y. [DOI] [PMC free article] [PubMed] [Google Scholar]
- 92.Bragatto P, Vairo T, Francesca MM, Fabiano B. The impact of the COVID-19 pandemic on the safety management in Italian Seveso industries. J Loss Prev Process Ind. 2021;70:104393. doi: 10.1016/j.jlp.2021.104393. [DOI] [PMC free article] [PubMed] [Google Scholar]
- 93.Ghorui N, Ghosh A, Prasad MS, Yazid BM, Ahmadiane A, Salahshour S, Ferrarag M. Identification of dominant risk factor involved in spread of COVID-19 using hesitant fuzzy MCDM methodology. Results Phys. 2021;21:103811. doi: 10.1016/j.rinp.2020.103811. [DOI] [PMC free article] [PubMed] [Google Scholar]
- 94.Labbi A, Mokhnache A. Derivation of split-window algorithm to retrieve land surface temperature from MSG-1 thermal infrared data. Eur J Remote Sensing. 2015;48:719–742. doi: 10.5721/EuJRS20154840. [DOI] [Google Scholar]
- 95.Adolph AC, Albert MR, Hall DK. Near-surface temperature inversion during summer at Summit, Greenland, and its relation to MODIS-derived surface temperatures. Cryosphere. 2018;12:907–920. doi: 10.5194/tc-12-907-2018. [DOI] [Google Scholar]
- 96.Labbi A. Estimation of daytime near-surface air temperature from satellite data. Remote Sensing Appl: Soci Environ. 2020;18:100305. [Google Scholar]
- 97.Muhammad S, Long X, Salman M. (2020) COVID-19 pandemic and environmental pollution: a blessing in disguise? Sci Total Environ. 2020;728:138820. doi: 10.1016/j.scitotenv.2020.138820. [DOI] [PMC free article] [PubMed] [Google Scholar]
- 98.Qureshi S, Shorabeh SN, Samany NN, Minaei F, Homaee M, Nickravesh F, Firozjaei MK, Arsanjani JJ. A New Integrated Approach for Municipal Landfill Siting Based on Urban Physical Growth Prediction: A Case Study Mashhad Metropolis in Iran. 2021;13(5):1–22. 10.3390/rs13050949
- 99.Krichen S, Faiz S, Tlili T, Tej K. Tabu-based GIS for solving the vehicle routing problem. Expert Syst Appl. 2014;41:6483–6493. doi: 10.1016/j.eswa.2014.03.028. [DOI] [Google Scholar]
- 100.Leite H, Hodgkinson IR, Gruber T. New development: ‘Healing at a distance’-telemedicine and COVID-19. Public Money Manag. 2020;40:483–485. doi: 10.1080/09540962.2020.1748855. [DOI] [Google Scholar]
- 101.Verma S, Gustafsson A. Investigating the emerging COVID-19 research trends in the field of business and management: a bibliometric analysis approach. J Bus Res. 2020;118:253–261. doi: 10.1016/j.jbusres.2020.06.057. [DOI] [PMC free article] [PubMed] [Google Scholar]
- 102.Mahnoor AS, Malik F, Shehzai AM, Farooq Siddiqui Gh, Anwar MN, Lamd SSh, Nizami AS, Khokhar MF. Exploring the linkage between PM2.5 levels and COVID-19 spread and its implications for socio-economic circles. Environ Res. 2021;193:110421. doi: 10.1016/j.envres.2020.110421. [DOI] [PMC free article] [PubMed] [Google Scholar]
- 103.Crick JM, Crick D. Coopetition and COVID-19: Collaborative business-to-business marketing strategies in a pandemic crisis. Ind Mark Manag. 2020;88:206–213. doi: 10.1016/j.indmarman.2020.05.016. [DOI] [Google Scholar]
- 104.Sharma GD, Thomas A, Paul J. Reviving tourism industry post-COVID-19: a resilience-based framework. Tour Managt Perspect. 2021;37:100786. doi: 10.1016/j.tmp.2020.100786. [DOI] [PMC free article] [PubMed] [Google Scholar]
- 105.Pappas N. COVID19: Holiday intentions during a pandemic. Tour Manag. 2021;84:104287. doi: 10.1016/j.tourman.2021.104287. [DOI] [PMC free article] [PubMed] [Google Scholar]
- 106.Afifi RA, Novak N, Gilbert PA, Pauly B, Abdulrahim S, Faiz S, Fernand R, Rashid O, Ferrand A. ‘Most at risk’ for COVID19? The imperative to expand the definition from biological to social factors for equity. Prevent Med. 2020;139:106229. doi: 10.1016/j.ypmed.2020.106229. [DOI] [PMC free article] [PubMed] [Google Scholar]
- 107.Abowd GD, Dey AK, Brown PJ, Davies N, Smith M, Steggles P. lecture notes in computer science (including subseries lecture notes in artificial intelligence and lecture notes in bioinformatics) Berlin: Springer Verlag; 1999. Towards a better understanding of context and context-awareness; pp. 304–307. [Google Scholar]
- 108.Anagnostopoulos C, Hadjiefthymiades S. (2009) On the application of epidemical spreading in collaborative context-aware computing. ACM SIGMOBILE Mobile Comput Commun Rev. 2009;12:43–55. doi: 10.1145/1508285.1508291. [DOI] [Google Scholar]
- 109.Benou P, Vassilakis C. The conceptual model of context for mobile commerce applications. Electron Commer Res. 2010;10:139–165. doi: 10.1007/s10660-010-9050-4. [DOI] [Google Scholar]
- 110.Samany NN. Automatic landmark extraction from geo-tagged social media photos using deep neural network. Cities. 2019;93:1–12. doi: 10.1016/j.cities.2019.04.012. [DOI] [Google Scholar]
- 111.Samany NN, Delavar MR, Chrisman N, Malek MR. FIA5: a customized fuzzy interval algebra for modeling spatial relevancy in urban context-aware systems. Eng Appl Artif Intell. 2014;33:116–126. doi: 10.1016/j.engappai.2014.04.004. [DOI] [Google Scholar]
- 112.Van Engelenburg S, Janssen M, Klievink B. Designing context-aware systems: a method for understanding and analysing context in practice. J Log Algebr Methods Program. 2019;103:79–104. doi: 10.1016/j.jlamp.2018.11.003. [DOI] [Google Scholar]
- 113.Intille SS, Kaushik P, Rockinson R (2010) Deploying context-aware health technology at home: human-centric challenges, Chapter 19—human-centric interfaces for ambient intelligence, 479–503.
- 114.Esposito M, Minutolo A, Megna R, Forastiere M, Magliulo M, De Pietro G. A smart mobile, self-configuring, context-aware architecture for personal health monitoring. Eng Appl Artif Intell. 2018;67:136–156. doi: 10.1016/j.engappai.2017.09.019. [DOI] [Google Scholar]
- 115.Nadizadeh Shorabeh S, Neysani Samany N, Minaei F, Karimi Firozjaei H. A decision model based on decision tree and particle swarm optimization algorithms to identify optimal locations for solar power plants construction in Iran. Renewable Energy, 2022;187:56–67.
- 116.Singh RP, Javaid M, Haleem A, Suman R. Internet of things (IoT) applications to fight against COVID-19 pandemic. Diabetes Metab Syndr. 2020;14:521–524. doi: 10.1016/j.dsx.2020.04.041. [DOI] [PMC free article] [PubMed] [Google Scholar]
- 117.Atlam HF, Wills GB. Intersections between IoT and distributed ledger. Adv Comput. 2019;115:73–113. doi: 10.1016/bs.adcom.2018.12.001. [DOI] [Google Scholar]
- 118.Piccialli F, Giampaolo F, Casolla G, Di Cola VS, Li K. A deep learning approach for path prediction in a location-based IoT system. Pervasive Mob Comput. 2020;66:101210. doi: 10.1016/j.pmcj.2020.101210. [DOI] [Google Scholar]
- 119.Kamal M, Aljohani A, Alanazi E (2020) IoT meets covid-19: status, challenges, and opportunities. In arXiv, 2020.
- 120.Connect HN (2020) Healthcare delivery, remimagined.
- 121.Care C (2020) Better health outcomes guaranteed.
- 122.Sehatyab. Tele-medicine to resuscitate primary care in Pakistan.
- 123.Rizvi S, Pipetti R, McIntyre N, Todd J, Williams I. Threat model for securing internet of things (IoT) network at device-level. Internet Things. 2020;11:100240. doi: 10.1016/j.iot.2020.100240. [DOI] [Google Scholar]


