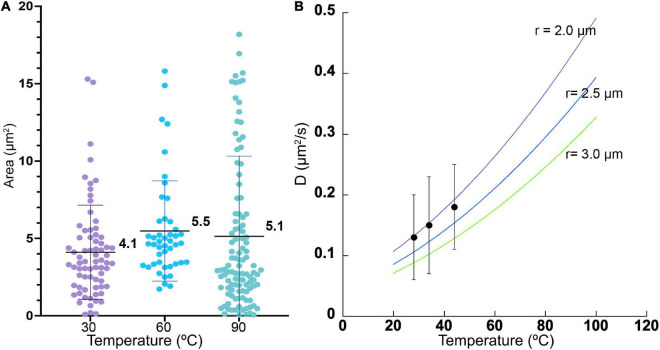
FIGURE 4.
Cell sizes and diffusion coefficients with temperature. (A) Cell area as estimated by microscopy, shown as mean ± standard deviation. The differences in the means from one temperature to the next was not significant. (B) Measured diffusion coefficients at 3 temperatures (black dots), with measured standard deviations, compared with predicted values according to Eq. (1) for particle radii of 2.0, 2.5, and 3.0 μm.

