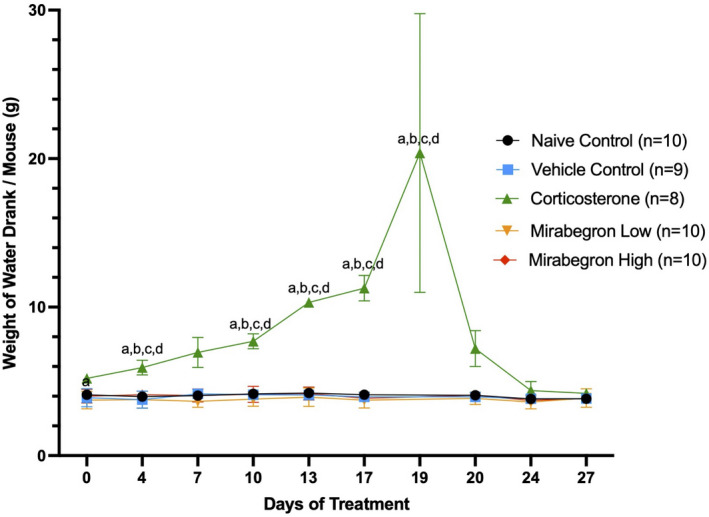
FIGURE 2.

Chronic corticosterone treatment resulted in mice drinking significantly (p ≤ 0.05) more of the treatment water during the course of the experiment. (a) represents significantly (p ≤ 0.05) different than the naïve control group, (b) represents significantly (p ≤ 0.05) different from the vehicle control group, (c) represents significantly (p ≤ 0.05) different from the mirabegron low treatment, and (d) represents significantly (p ≤ 0.05) different from the mirabegron high treatment
