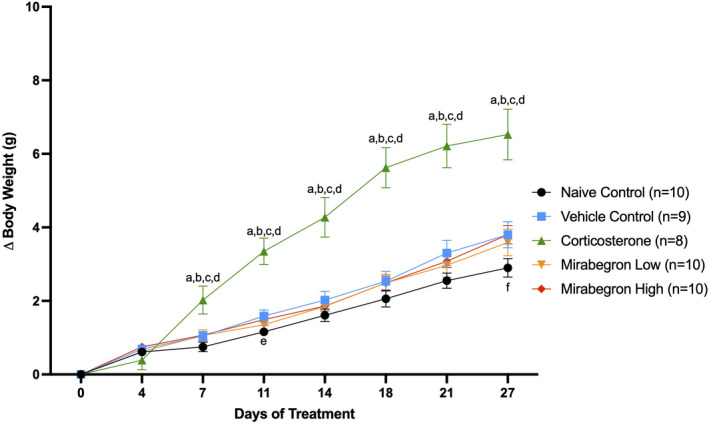
FIGURE 3.

Summary of changes in body weight during four weeks of treatment. The corticosterone‐treated mice gained significantly (p ≤ 0.05) more weight than both the naïve and vehicle controls, and both mirabegron treatments. This illustrates the change in body weight from the beginning of the experiment during the treatment. (a) represents significantly (p ≤ 0.05) different than the naïve control group, (b) represents significantly (p ≤ 0.05) different from the vehicle control group, (c) represents significantly (p ≤ 0.05) different from the mirabegron low treatment, (d) represents significantly (p ≤ 0.05) different from the mirabegron high treatment, (e) represents the vehicle group being significantly (p ≤ 0.05) different than the naïve control group and (f) represents the mirabegron high group being significantly (p ≤ 0.05) different than the naïve control group. Error bars represent SEM
