
FIGURE 4.
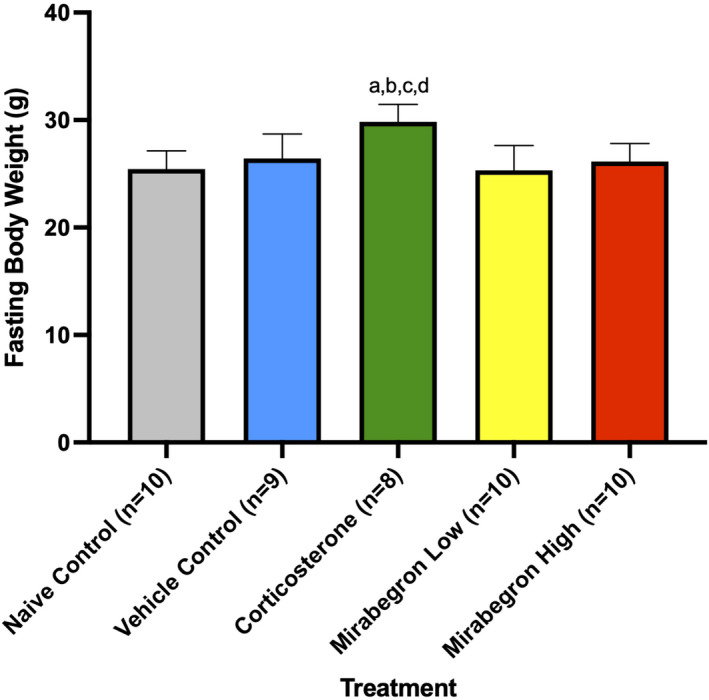
Fasting body weights at the end of treatment. Corticosterone‐treated mice were significantly (p ≤ 0.05) heavier than all other treatment groups. (a) represents significantly (p ≤ 0.05) different than the naïve control group, (b) represents significantly (p ≤ 0.05) different from the vehicle control group, (c) represents significantly (p ≤ 0.05) different from the mirabegron low treatment, and (d) represents significantly (p ≤ 0.05) different from the mirabegron high treatment