FIGURE 6.

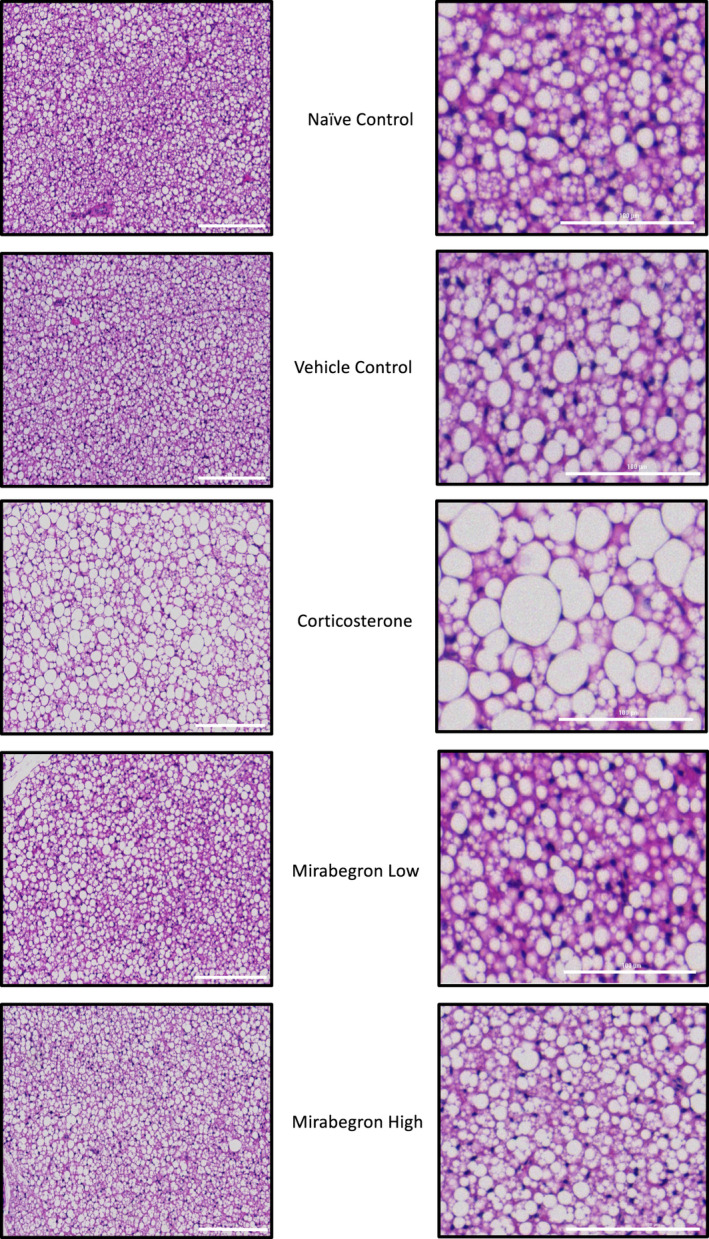
Representative images of BAT at 10× magnification from each treatment where the scalebar represents 200 μm in the large field of view (left) and the magnified image scalebar represents 100 μm (right)

Representative images of BAT at 10× magnification from each treatment where the scalebar represents 200 μm in the large field of view (left) and the magnified image scalebar represents 100 μm (right)