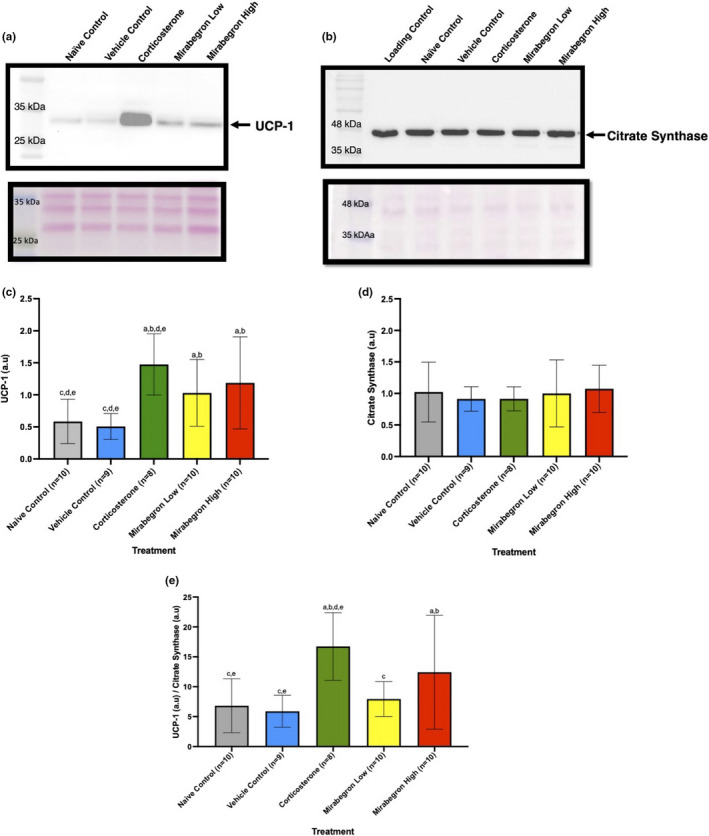
FIGURE 9.

BAT UCP‐1 (a and c) and Citrate Synthase (b and d) protein expression under each treatment and relative ratio (e). The corticosterone group illustrated a significant (p ≤ 0.05) increase in the amount of UCP‐1 (a and c) expressed in each BAT when compared to the naïve and vehicle control groups (corresponding ponceau S stain is below the blot). The citrate synthase protein expressed (b and d) in each BAT remained the same amongst all treatments (corresponding ponceau S stain is below the blot). The observed size of citrate synthase is 45 kDa while the protein size is 51 kDa according to the manufacturer. The ratio of UCP‐1 to citrate synthase (e) is significantly (p ≤ 0.05) greater in both the corticosterone and mirabegron high treatments compared to both the naïve and vehicle controls. (a) represents significantly (p ≤ 0.05) different than the naïve control group, (b) represents significantly (p ≤ 0.05) different from the vehicle control group, (c) represents significantly (p ≤ 0.05) different from the corticosterone treatment, (d) represents significantly (p ≤ 0.05) different from the mirabegron low treatment, and (e) represents significantly (p ≤ 0.05) different from the mirabegron high treatment
