Figure 1.

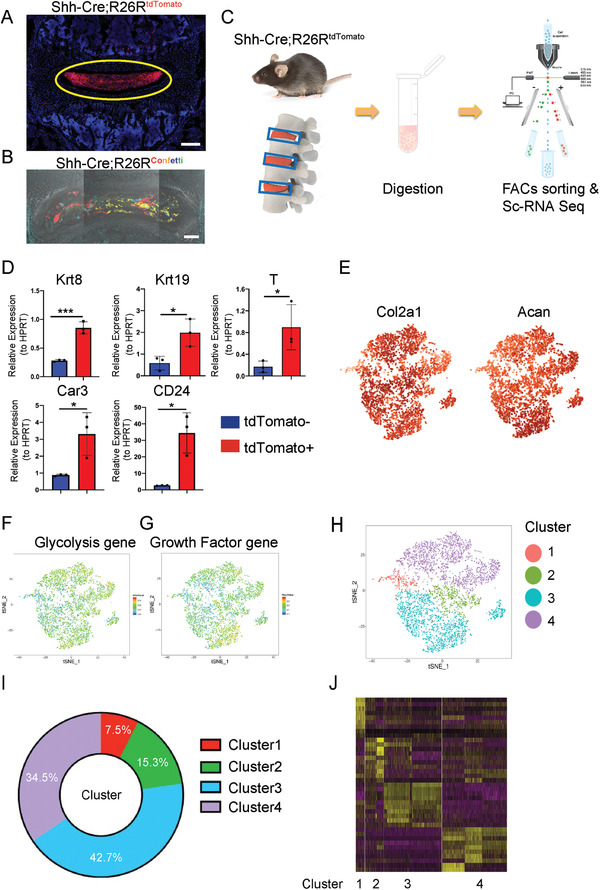
Single‐cell RNA sequencing analysis of murine NP cells from Shh‐Cre;R26RtdTomato mice. A) Representative images of lumbar sections from 4‐week‐old Shh‐Cre;R26RtdTomato mice. The yellow circle shows NP tissue. Scale bars, 100 µm. B) Representative image of lumbar sections from 4‐week‐old Shh‐Cre; R26Rconfetti mice. Scale bars, 100 µm. C) Schematic workflow of the experimental strategy. Purified NP cells were isolated from Shh‐Cre;R26RtdTomato mice, enzymatically digested, and FACS‐sorted to isolate tdTomato+ cells, which then underwent single‐cell RNA sequencing analysis via BD Rhapsody. D) qRT‐PCR of expression of NP marker genes, including Krt8, Krt19, T, Car3, and CD24 related to HPRT in Shh‐Cre;R26RtdTomato+ and Shh‐Cre;R26RtdTomato‐ cells. E) Dot plots showing the expression of Col2a1 and Acan within the t‐SNE map. F,G) t‐SNE plots of glycolysis gene (F) and growth factor gene (G) distribution. H) Representative image of t‐SNE analysis showing the four clusters of Shh‐Cre;Ai9+ NP cells. (I) Relative percentage of each cluster among Shh‐Cre;Ai9 NP cells. J) Heatmap revealing the scaled expression of differentially expressed genes for each cluster. n = 3. Data are presented as mean ± standard deviation. * P < 0.05, ** P < 0.01; N.S., not significant as determined by two‐tailed Student t tests.
