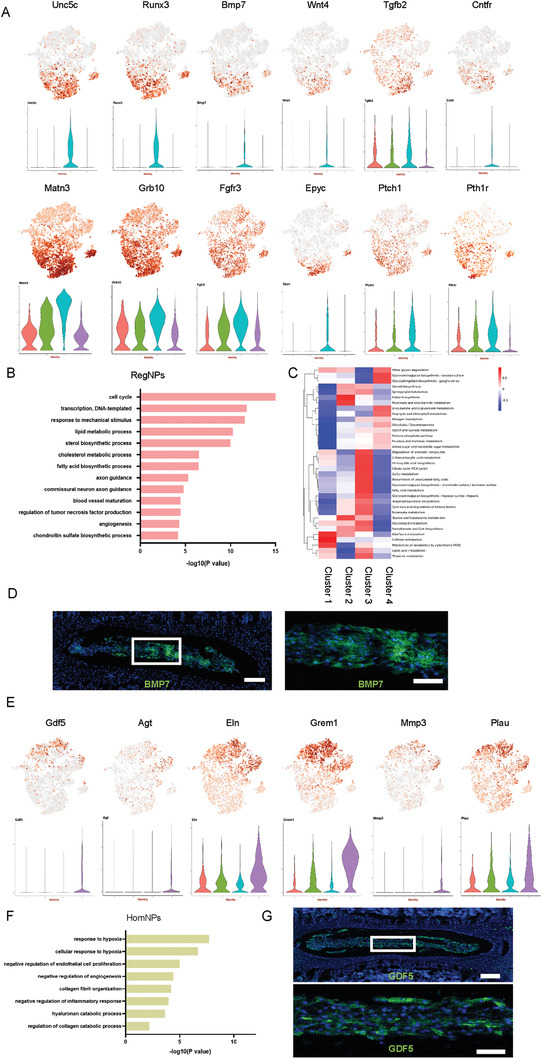
Figure 2.

RegNPs were a metabolically active and mechanically sensitive population, while HomNPs were sensitive to hypoxia with “degenerative” potential. A) t‐SNE plots and representative violin plots showing the expression of Unc5c, Runx3, Bmp7, Wnt4, Tgfb2, CNTFR, Matn3, Grb10, Fgfr3, Epyc, Ptch1, and Pth1r on the t‐SNE map. B) Representation analysis of GO categories showing different functions for RegNPs. C) Heatmap revealing metabolic‐related functions and pathways for RegNPs. D) Representative images of lumbar spine sections from 4‐week‐old wild‐type mice stained for BMP7. Scale bars, 100 µm (n = 3 mice per group). E) t‐SNE plots and representative violin plots showing the expression of Gdf5, Agt, Eln, Grem1, Mmp3, and Plau on the t‐SNE map. F) Representative analysis of GO categories showing different functions for HomNPs. G) Representative images of lumbar spine sections from 4‐week‐old WT mice stained for GDF5. The lower image shows a high‐magnification view of the indicated area from the upper image. Scale bars, 100 µm (n = 3 mice per group).
