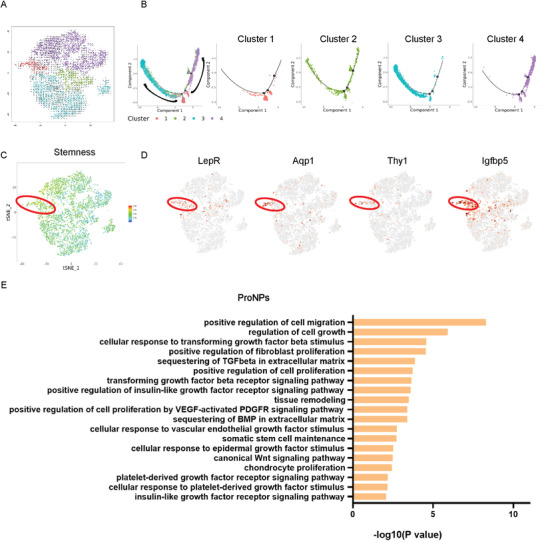
Figure 3.

Characterization of potential NP cell progenitors in Cluster 1. A) Velocity image showing the potential trajectories among NP subpopulations. B) Monocle pseudospace trajectories revealing the NP cell lineage progression colored according to cell types. C) Stemness analysis of NP cell subpopulations using mesenchymal stem/progenitor cell markers. D) Dot plots showing the expression of LepR, Aqp1, Thy1, and Igfbp5 on the t‐SNE map. E) Representation analysis of GO categories showing different functions for ProNPs.
