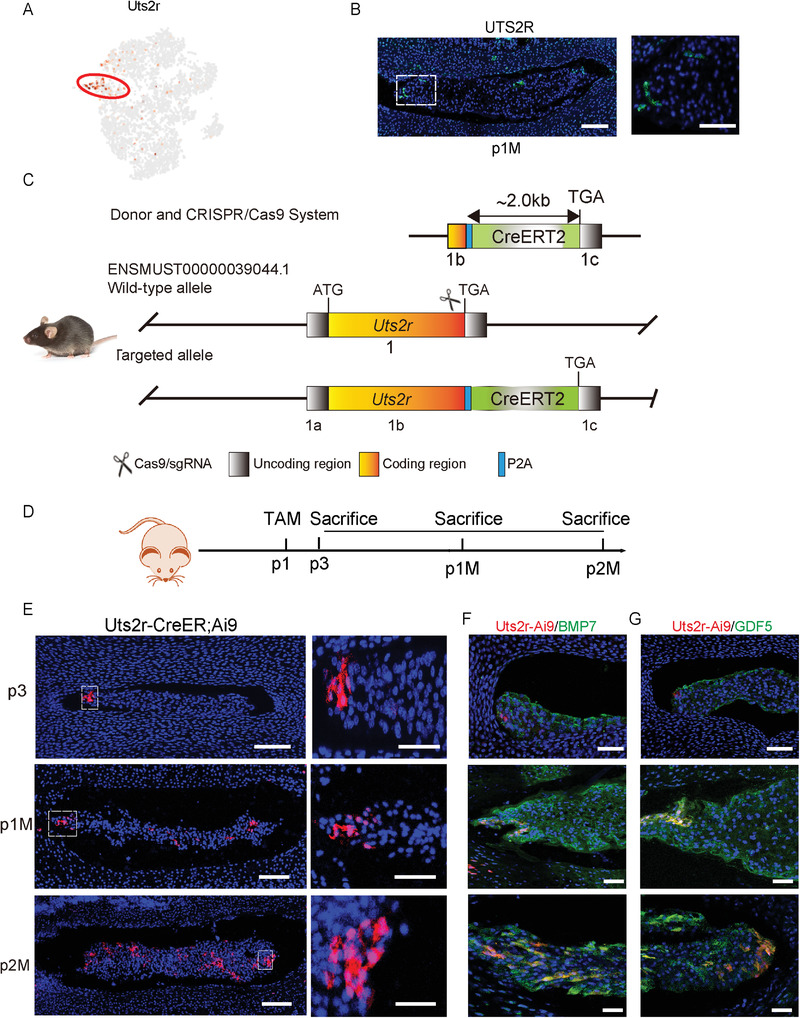
Figure 4.

Lineage tracing of UTS2R+ NP cells. A) Dot plot showing the expression of Uts2r on the t‐SNE map. B) Representative immunofluorescence imaging of UTS2R (green) in postnatal 1‐month‐old WT mice. The right image shows high magnification of the indicated area from the left image (n = 3 mice per group). Scale bars, 100 µm. C) Construction strategy of Uts2r‐CreER transgenic mice using the CRISPR/Cas9 System. D) Diagram showing postnatal day 1 (P1) Uts2r‐CreER;Ai9/+ mice administered with one dosage tamoxifen and sacrificed at postnatal day 3 (P3), 1 month (P1M), or 2 months (P2M). E) Representative immunofluorescence imaging of Uts2r‐CreER;Ai9+ cells (red). The right images show high magnification of the indicated area from the left image (n = 3 mice per group). Scale bars, 100 µm. F,G) Representative immunofluorescence imaging of Uts2r‐CreER;Ai9+ cells (red), BMP7 (green) (F) or GDF5 (green) (G). The right images show high magnification of the indicated area from the left image (n = 3 mice per group). Scale bars, 100 µm.
