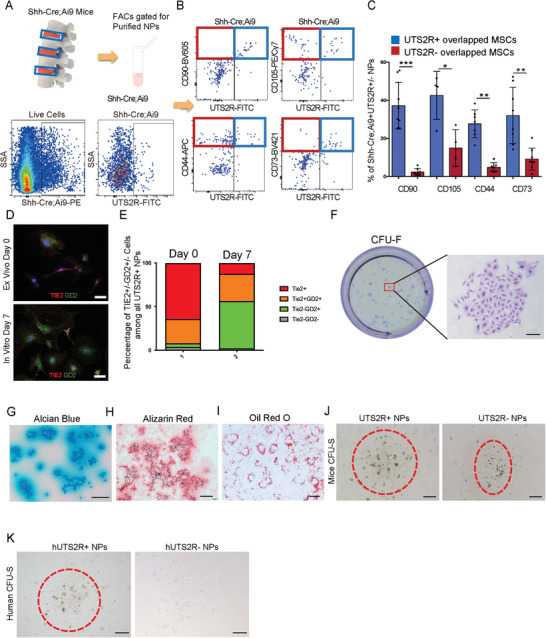
Figure 5.

Identification of UTS2R+ NP cell progenitors in Cluster 1. A,B) Diagram of isolating (A) and FACS gating strategy of Shh‐Cre;Ai9+UTS2R+ ProNPs (B). C) Quantification of the percentage of ProNPs expressing markers of mesenchymal stem/progenitor cells in 4‐week‐old Shh‐Cre;Ai9 mice, n ≥ 4. D) Representative immunofluorescence staining of Tie2 and GD2 in murine UTS2R+ NP cells from the ex vivo plated group and the in vitro 7‐day cultured group. Cells were sorted by isolating disc cells from 4‐week‐old Shh‐Ai9 mice and gating on the Shh‐Ai9+UTS2R+ channel. E) Quantification of Tie2+, Tie2+GD2+, Tie2−GD2+, and Tie2−GD2− cells in all sorted murine UTS2R NP cells. F) Crystal violet staining revealing the CFU‐F‐forming ability of rat UTS2R+ ProNPs. G–I) Alcian blue (G), Alizarin Red (H), and Oil Red O staining (I) of rat ProNPs under chondrogenic, osteogenic, or adipogenic differentiation conditions. J,K) CFU‐sphere‐forming ability of UTS2R+ and UTS2R− NP cells isolated from rat (J) and human specimens (K). Data are presented as mean ± standard deviation. * P < 0.05, ** P < 0.01; N.S., not significant as determined by ANOVA.
