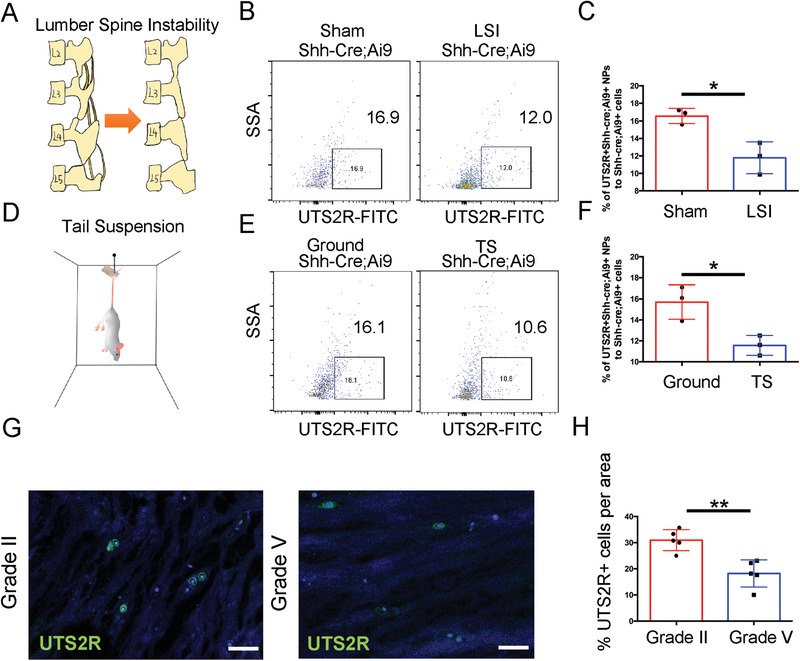
Figure 6.

ProNPs were exhausted during intervertebral disc degeneration. A) LSI model was established in 4‐week‐old Shh‐Cre;Ai9 mice. B,C) FACS analysis and quantification of Shh‐Cre;Ai9+UTS2R+ NP cells in Shh‐Cre;Ai9 mice from Sham (control) and LSI groups. D) Tail suspension model was established in 4‐week‐old Shh‐Cre;Ai9 mice. E,F) FACS analysis and quantification of Shh‐Cre;Ai9+UTS2R+ NP cells in Shh‐Cre;Ai9 mice from Ground (control) and TS groups. G,H) Immunofluorescence staining and representative quantification data of UTS2R+ cells in human NP specimens at different degeneration levels. n = 3. Data are presented as mean ± standard deviation. * P < 0.05, ** P < 0.01; N.S., not significant as determined by two‐tailed Student t tests.
