Figure 8.

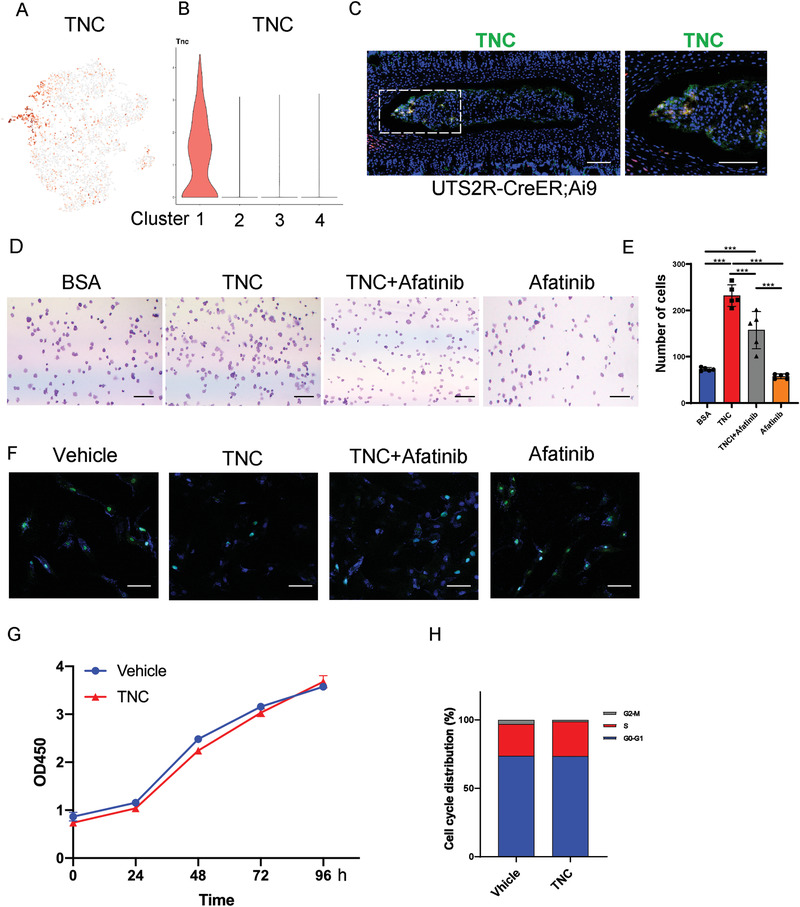
Tenascin‐C was expressed in the ProNPs niche and maintained homeostasis. A,B) Dot plot (A) and representative violin plot (B) showing the expression of TNC in Clusters 1–4. C) Representative immunofluorescence imaging of Uts2r‐CreER;Ai9+ cells (red) and TNC (green) in postnatal 1‐month‐old Uts2r‐CreER;Ai9/+ mice traced from P3. The right image shows high magnification of the indicated area from the left image (n = 3 mice per group). Scale bars, 100 µm. D,E) Cell adhesion analysis (D) and quantification (E) of rat UTS2R+ NP cells. FACS‐sorted UTS2R+ NP cells cultured on a plate pre‐coated with BSA (control), 500 ng mL−1 TNC, 500 ng mL−1 TNC + 10 × 10−6 m Afatinib, and 10 × 10−6 m Afatinib alone for 24 h. F) TUNEL staining of rat UTS2R+ NP cells cultured with a vehicle, 500 ng mL−1 TNC, 500 ng mL−1 TNC + 10 × 10−6 m Afatinib, and 10 × 10−6 m Afatinib under serum‐free‐induced apoptosis for 12 h. G,H) CCK8 (G) and Cell cycle analysis (H) of rat UTS2R+ NP cells cultured with or without 500 ng mL−1 TNC. n = 3. Data are presented as mean ± standard deviation. * P < 0.05, ** P < 0.01, *** P < 0.001 as determined by ANOVA.
