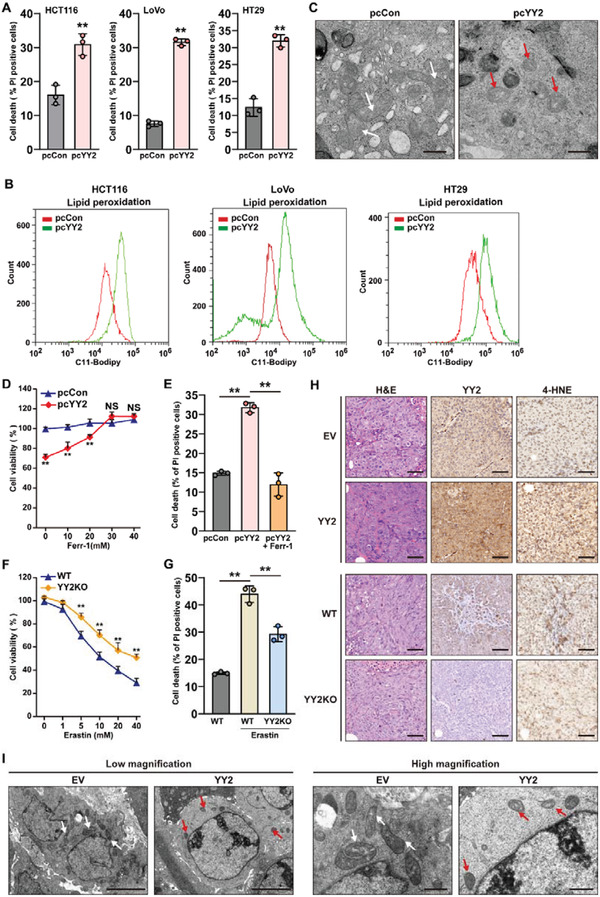
Figure 2.

YY2 suppresses tumor cells viability by inducing ferroptosis. A) Cell death percentage of YY2‐overexpressed HCT116, and LoVo, HT29 cells, as analyzed using PI staining and flow cytometry. B) Lipid peroxidation in YY2‐overexpressed HCT116, LoVo, and HT29 cells, as assessed by C11‐BODIPY staining and flow cytometry. C) Transmission electron microscopy images of mitochondria in HCT116 cells overexpressing YY2. White arrows, mitochondria with obvious cristae; red arrows, shrunken mitochondria. Scale bars: 1 μm. D) Cell viability of HCT116 cells overexpressing YY2 and treated with indicated concentration of ferrostatin‐1 for 36 h. E) Cell death percentage of HCT116 cells overexpressing YY2 and treated with 30 μ m ferrostatin‐1 for 24 h. F) Cell viability of HCT116YY2null cells treated with indicated concentration of erastin for 36 h. G) Cell death percentage of HCT116YY2null cells treated with 20 μ m erastin for 24 h. H) Immunohistochemical staining images against YY2 and 4‐HNE in the tissue section of xenografted tumors formed by HCT116 cells overexpressing YY2 and HCT116YY2null cells. Scale bars, 50 μm. I) Transmission electron microscopy images of the mitochondria in the xenograft tumors formed by HCT116 cells overexpressing YY2. White arrows: mitochondria with obvious cristae; red arrows: shrunken mitochondria. Scale bars: left, 5 μm; right, 1 μm. Wild‐type HCT116 cells, cells transfected with pcCon or infected with empty lentivirus (EV) were used as controls. Quantification data are shown as mean ± SD (n = 3). p values were calculated using two‐tailed unpaired Student's t‐test. One‐way ANOVA analyses were performed when more than two groups were compared. pcCon: pcDNA3.1(+); YY2KO: HCT116YY2null cells; Ferr‐1: ferrostatin 1; ** p < 0.01; NS: not significant.
