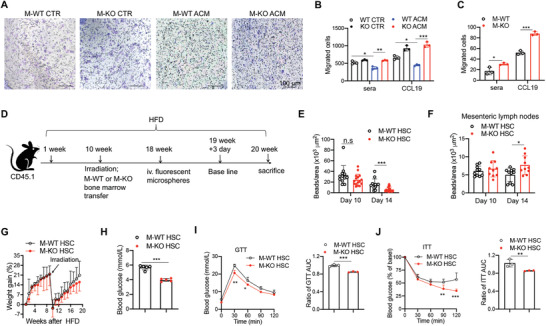
Figure 4.

Macrophage deficiency of CD146 reduces macrophage retention in the adipose tissue. A) Represented images (200×) and B) statistical analysis of BMDMs treated with medium or ACM for 24 h (representative of n = 3). Migration assays were performed in the presence of sera or CCL19. C) Migrated cells from isolated VAT ATMs in the presence of sera or CCL19 (representative of n = 3). D) Schematic representation of the macrophage tracking model. E) In vivo analysis of the recruitment of bead‐labeled macrophages to and retention in VAT of CD146M‐WT→CD45.1+ (M‐WT HSC) and CD146M‐KO→CD45.1+ (M‐KO HSC) mice fed with HFD (n = 5 mice per group). F) Mean numbers of beads in mesenteric lymph nodes on days 10 and 14 (n = 5 mice per group). G) Body weight gain of M‐WT HSC and M‐KO HSC mice (n = 5). H) Fasting blood concentrations of glucose in M‐WT HSC and M‐KO HSC mice (n = 5). I) GTT and J) ITT of M‐WT HSC and M‐KO HSC mice (n = 5 for each group). The histograms on the right show the corresponding AUCs. Each symbol represents an experiment (B, C, I, and J) or an individual section (E, F) or mouse (H); the short horizontal lines indicate the mean ± SEM (H) or SD (B, C, E, F, I, and J) . For significance analysis, one‐way ANOVA (B, C, E, and F) or two‐tailed t‐test (H, I, and J) or two‐way ANOVA with multiple‐comparison test (I and J) was performed. n.s., not significant; *p < 0.05, **p < 0.01, ***p < 0.001.
