. 2019 Jul 29;9(41):23508–23525. doi: 10.1039/c9ra03962g

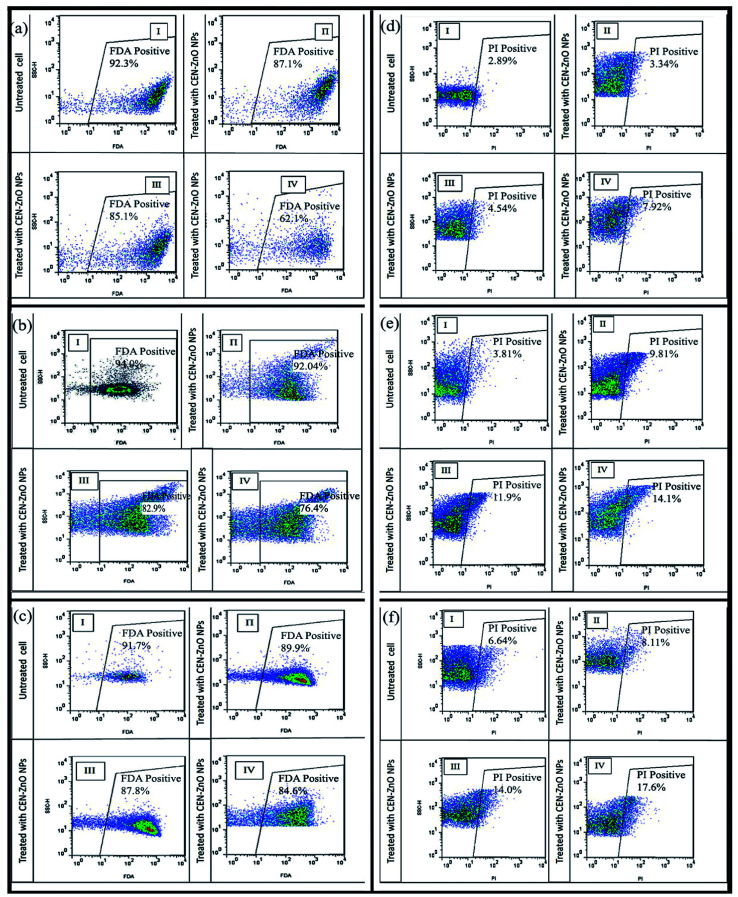
Fig. 10. Flow cytometric analysis of (a) P. aeruginosa, (b) E. coli and (c) S. aureus. The cell viability level as indicated by fluorescein diacetate (FDA) staining (a) and (b) cytograms I: control (untreated sample); II: treated with CEN-ZnO NPs (500 μg ml−1), III: (1500 μg ml−1) and IV: (2500 μg ml−1). (c) Cytograms I: control (untreated sample); II: S. aureus treated with CEN-ZnO NPs (16 μg ml−1), III: (32 μg ml−1) and IV: (64 μg ml−1). Flow cytometric analysis of (d) P. aeruginosa, (e) E. coli and (f) S. aureus. Membrane internalization staining using prodidium iodide (PI). (a) and (b) Cytograms I: control (untreated sample); II: treated with CEN-ZnO NPs (500 μg ml−1), III: (1500 μg ml−1) and IV: (2500 μg ml−1). (c) Cytograms I: control (untreated sample); II: S. aureus treated with CEN-ZnO NPs (16 μg ml−1), III: (32 μg ml−1) and IV: (64 μg ml−1).

Fig. 10