. 2019 Jul 29;9(41):23508–23525. doi: 10.1039/c9ra03962g

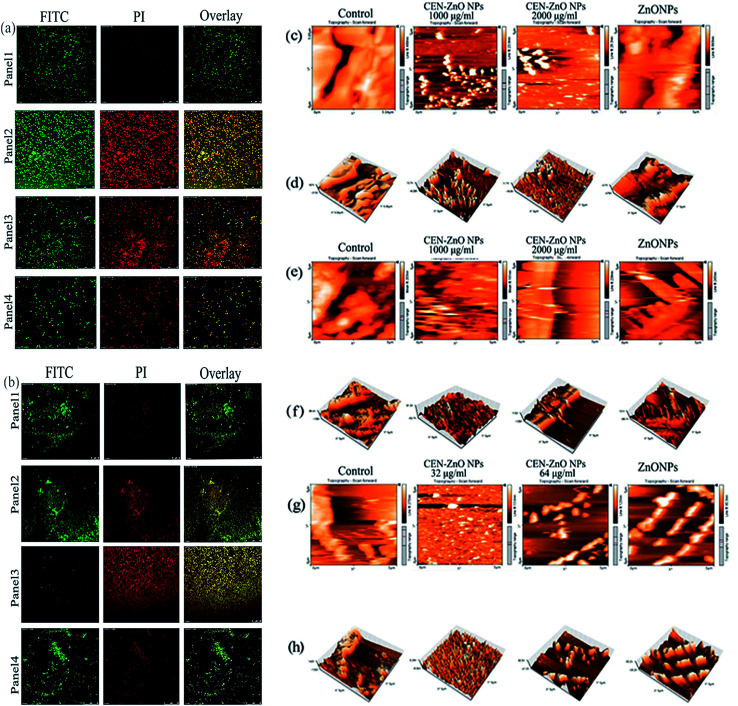
Fig. 9. CLSM micrograph of P. aeruginosa (a). S. aureus (b) biofilm. Panel 1 from left to right represent CLSM images of a native biofilm (without CEN-ZnONPs). Panel 2 and panel 3 from left to right represent CLSM images of P. aeruginosa (a). S. aureus (b) biofilms treated with CEN-ZnONPs (1500 μg ml−1) and (2500 μg ml−1) for P. aeruginosa and (32 μg ml−1), (64 μg ml−1) for S. aureus. Panel 4 from left to right show CLSM images of P. aeruginosa (a). S. aureus (b) biofilm treated with ZnO NPs (6500 μg ml−1) for P. aeruginosa and (5000 μg ml−1) for S. aureus. AFM images of (c) E. coli topography view and (d) 3D view, (e) P. aeruginosa topography view, (f) 3D view, (g) S. aureus topography view, and (h) 3D view biofilm. Right images shows native biofilm (no treated with CEN-ZnONPs), whereas, middle images represent AFM images of (c) E. coli, (e) P. aeruginosa and (g) S. aureus biofilms treated with CEN-ZnO NPs. Left images represent AFM images of (c) E. coli, (e) P. aeruginosa and (g) S. aureus biofilm treated with ZnO NPs.

Fig. 9