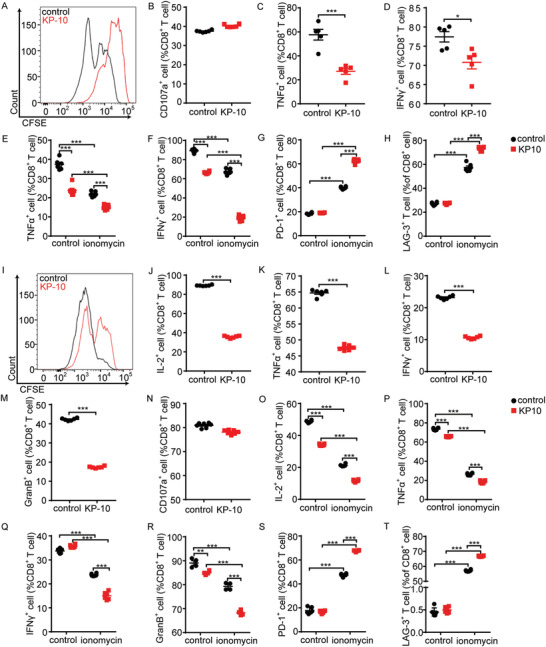
Figure 3.

Kisspeptin impairs CD8+ T cell function. Mouse splenic CD8+ T cells were pretreated with KP‐10 (10 × 10−6 m) for 6 h, A) stained with carboxyfluorescein diacetate succinimidyl ester (CFSE), and the cell proliferation was measured 72 h later by FCM. B) CD107a with phorbol 12‐myristate 13‐acetate (PMA)/ionomycin plus protein transport inhibitor cocktail for 3 h then degranulation measured by FCM (n = 6). CD8+ T cells with PMA/ionomycin plus protein transport inhibitor cocktail for 4 h, flow cytometry measured C) TNFα and D) IFNγ release (n = 6). Mouse splenic CD8+ T cells were pretreated with KP‐10 (10 × 10−6 m) for 6 h, ionomycin for 16 h, then α‐CD3/α‐CD28 for 24 h, followed by E) TNFα and F) IFNγ release (n = 6) measured by FCM. Mouse splenic CD8+ T cells were pretreated with KP‐10 (10 × 10−6 m) for 6 h, ionomycin for 6 h, then FCM detection of G) PD‐1 and H) LAG‐3 expression levels (n = 6). Human peripheral CD8+ T cells were pretreated with KP‐10 (10 × 10−6 m) for 6 h, I) stained with CFSE, and cell proliferation were measured 72 h later by FCM. CD8+ T cells with PMA/ionomycin plus protein transport inhibitor cocktail for 4 h, J) FCM measured IL‐2, K) TNFα, L) IFNγ, and M) granzyme B (GranB) release (n = 6). N) CD107a with PMA/ionomycin plus protein transport inhibitor cocktail for 3 h then degranulation measured by FCM (n = 6). Human peripheral CD8+ T cells were pretreated with KP‐10 (10 × 10−6 m) for 6 h, ionomycin for 16 h, then PMA/ionomycin plus protein transport inhibitor cocktail for 4 h, followed by O) IL‐2, P) TNFα, Q) IFNγ, and R) GranB release (n = 6) measured by FCM. Human peripheral CD8+ T cells were pretreated with KP‐10 (10 × 10−6 m) for 6 h, ionomycin for 6 h, then S) FCM‐detected PD‐1 and T) LAG‐3 expression levels (n = 6). All data are from at least three independent experiments. Data are represented as the mean ± SEM. *P < 0.05, **P < 0.01, ***P < 0.001 by unpaired Student's t‐test (B–D, J–N) or one‐way analysis of variance (ANOVA) followed by least significant difference (LSD) analysis (E–H, O–T).
