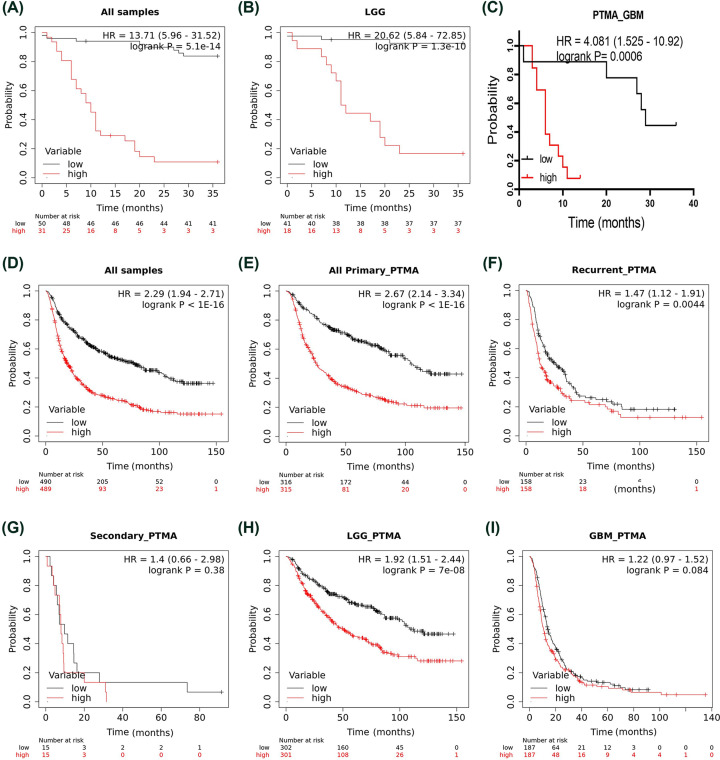
Figure 3. Association of PTMA expression with patient survival.
A-C and D-I represent the AIIMS cohort and CGGA dataset cohort, respectively. (A) All grades combined, (B) LGG, (C) GBM, (D) pan glioma analysis, (E) primary glioma tissues, (F) secondary glioma tissues, (G) recurrent glioma tissues, (H) LGG in CGGA, (I) GBM in CGGA. Abbreviation: GBM, glioblastoma multiforme. In all the panels, the low and high variable refers to low and high PTMA expression, respectively.

