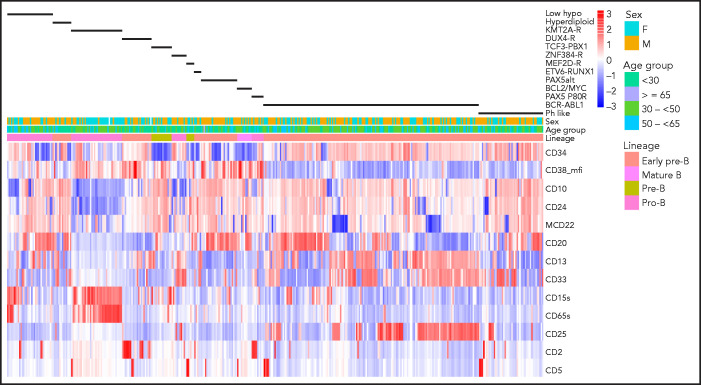
Figure 1.
Antigen expression in major molecular subgroups. Unsupervised hierarchical clustering of antigen expression in each of 413 E2993 patients. The patient cohort consists of 244 samples from E2993 patients who were BCR-ABL1− and were genotyped (excluding molecular subgroups with <5 patients and B-other) and 169 E2993 patients with BCR-ABL1 ALL. This approach identified characteristic antigen expression profiles within each of the 13 molecular subtypes, shown as black bars above the heatmap. Columns represent patients, and rows are antigens. Antigens are listed to the right of the heatmap. Expression levels reflect the percentage of antibody-binding leukemic lymphoblasts, except for CD38_mfi, which reflects intensity of antigen expression. High expression and low expression of antigens in the heatmap are shown in shades of red and blue, respectively. The first row above the heatmap aligns genotypes with B-lineage maturation stages. ZNF384-R includes ZNF384-like; ETV6-RUNX1 includes ETV6-RUNX1-like; KMT2A-R includes patients who were both KMT2A-AFF1 and KMT2A–non-AFF1; low_hypo, LH and NH; mcd22, membrane (surface) CD22.

