Figure 1.

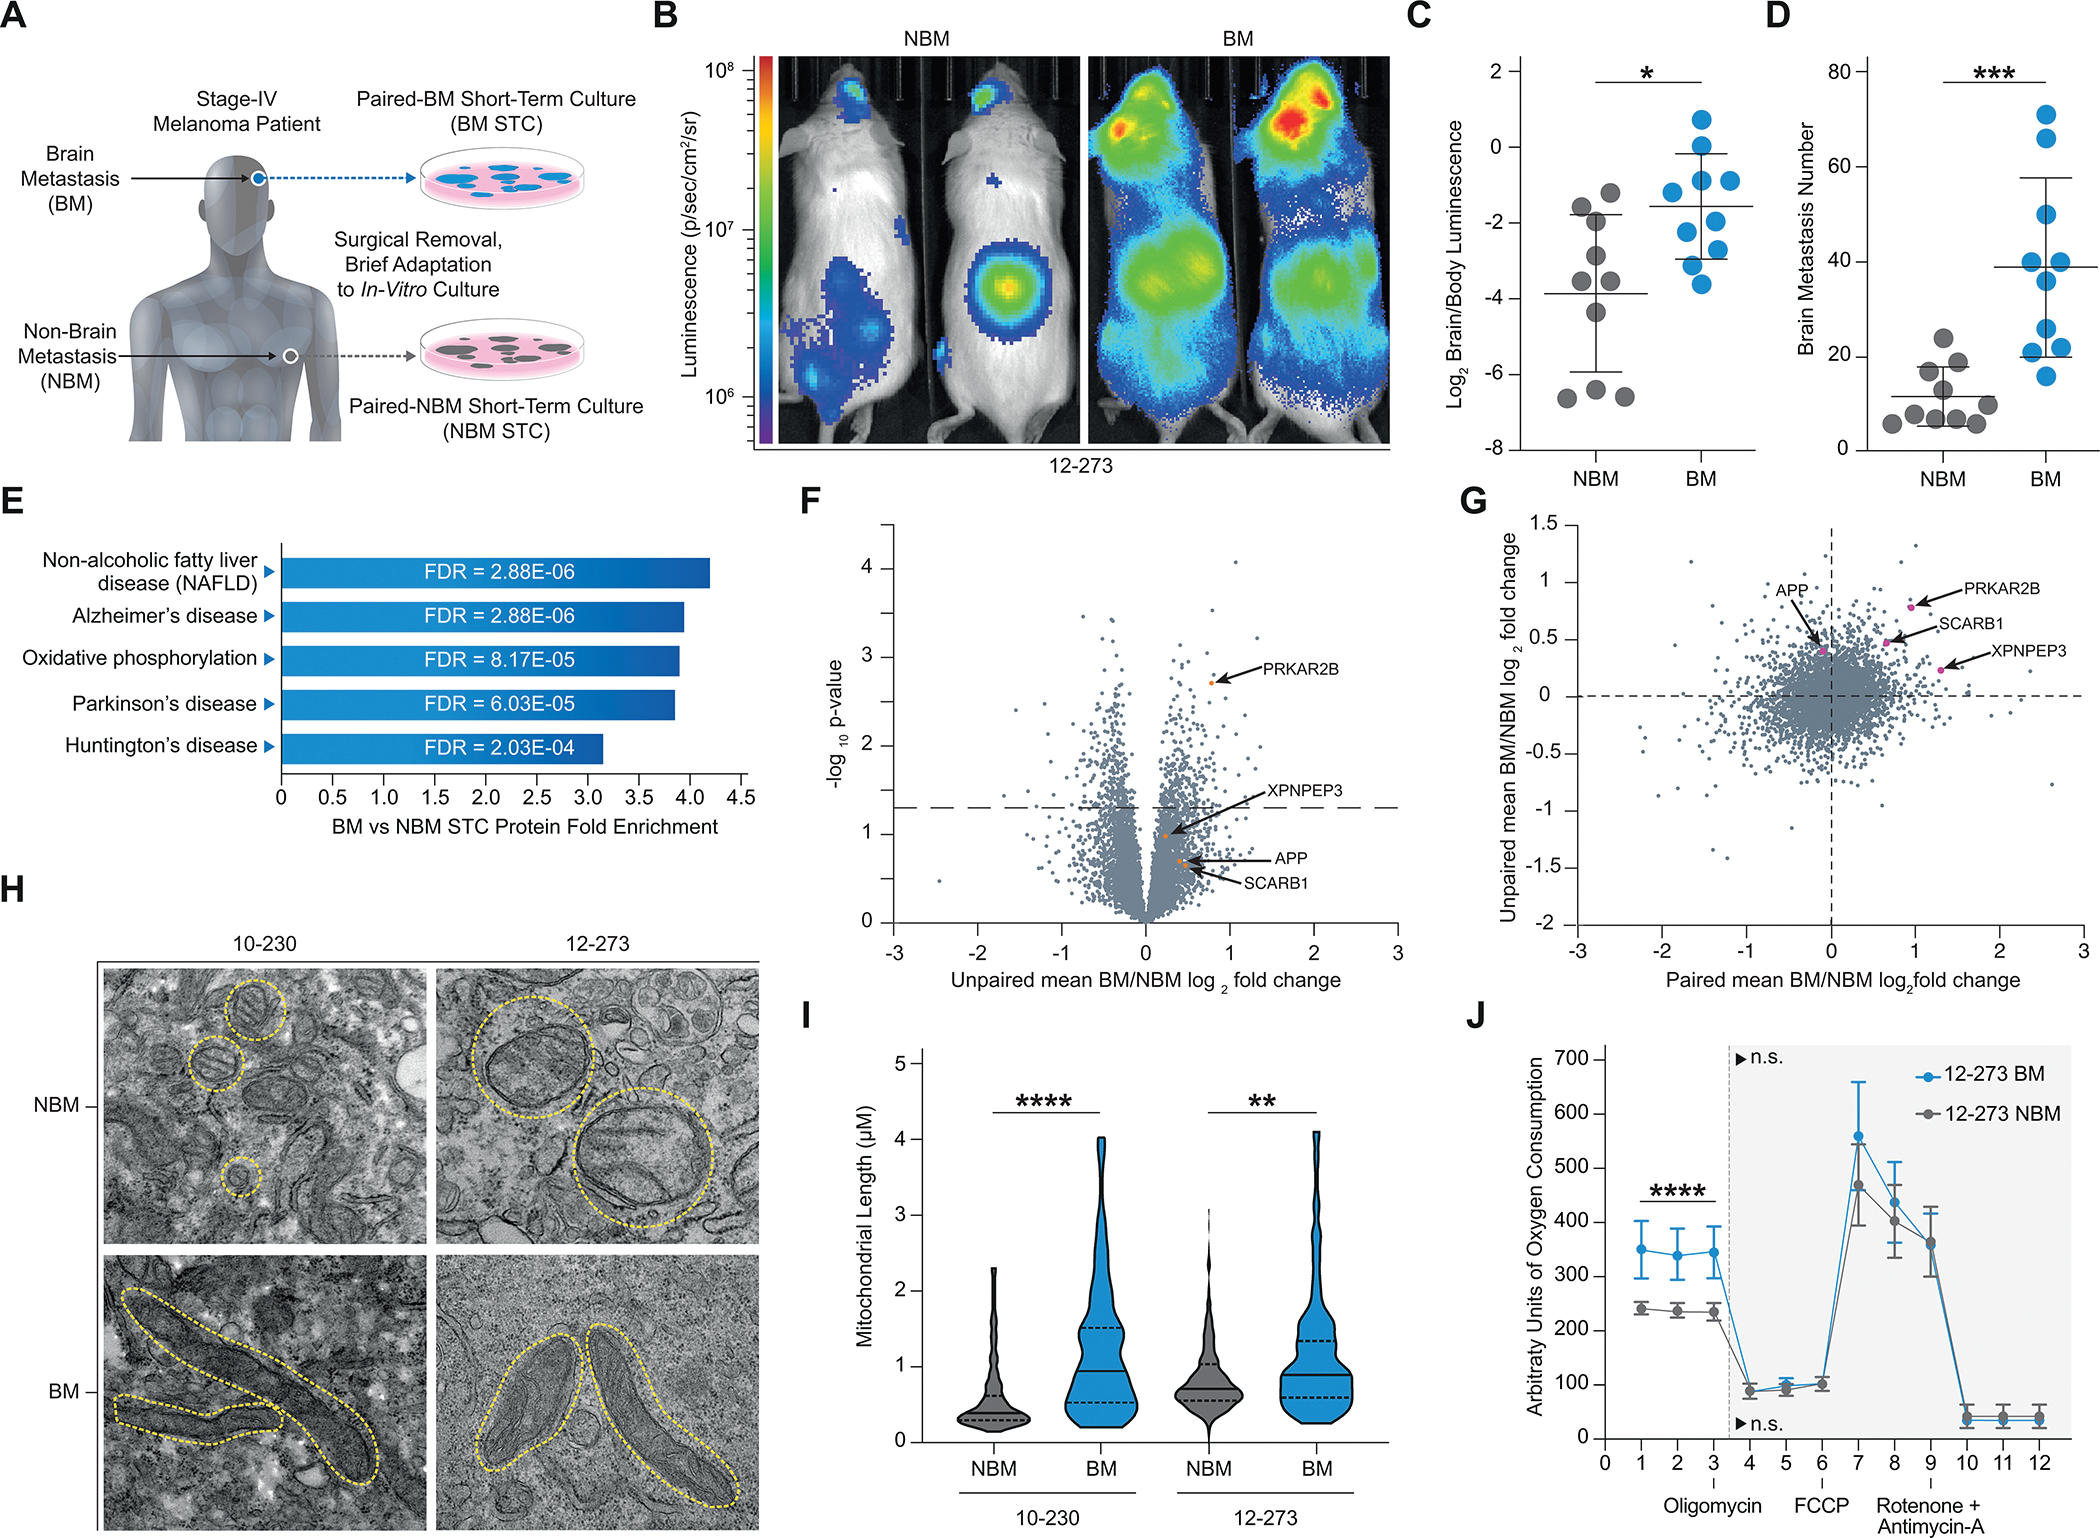
Proteomics Links Melanoma Brain Metastasis and Neurodegeneration. A, Diagram of the generation of patient-matched STC pairs. B-D, Intracardiac injection of 12–273 paired STCs in mice (10 NSG mice per group, representative experiment shown). B, Representative IVIS images of 12–273 STC pair at 29 days post intracardiac injection. C, Quantified brain/body luminescence ratio on day 29. 12–273 NBM vs. BM (* p<0.05). D, Number of brain metastases quantified by microscopy of serial FFPE sections with H&E staining. 12–273 NBM vs. BM (***, p<0.0005). E-G, Mass spectrometry analysis of whole cell lysates from a cohort of 12 BM and 12 NBM STCs, including 3 patient-matched pairs. E, Top enriched pathways (p<0.001) in BM vs NBM STCs identified by KEGG Pathway analysis of global protein levels. F, Volcano plot of mean Log2 BM/NBM fold change of global protein levels and -Log10 p-values. Orange – candidates selected for in-vivo mini-screen. G, Comparison of mean paired STC BM/NBM Log2 fold change to unpaired STC BM/NBM mean Log2 fold change. Pink – candidates selected for in-vivo mini-screen. H, Representative electron microscopy images of paired STCs. Yellow circles outline mitochondria. I, Quantification of average mitochondrial length in paired STCs. 10–230 NBM vs. BM (**** p<.00005), 12–273 NBM vs. BM (** p<.005). J, Seahorse MitoStress analysis of oxygen consumption rate in 12–273 NBM vs. BM. Basal oxygen consumption rate. 12–273 NBM vs BM (**** p<.00005).
