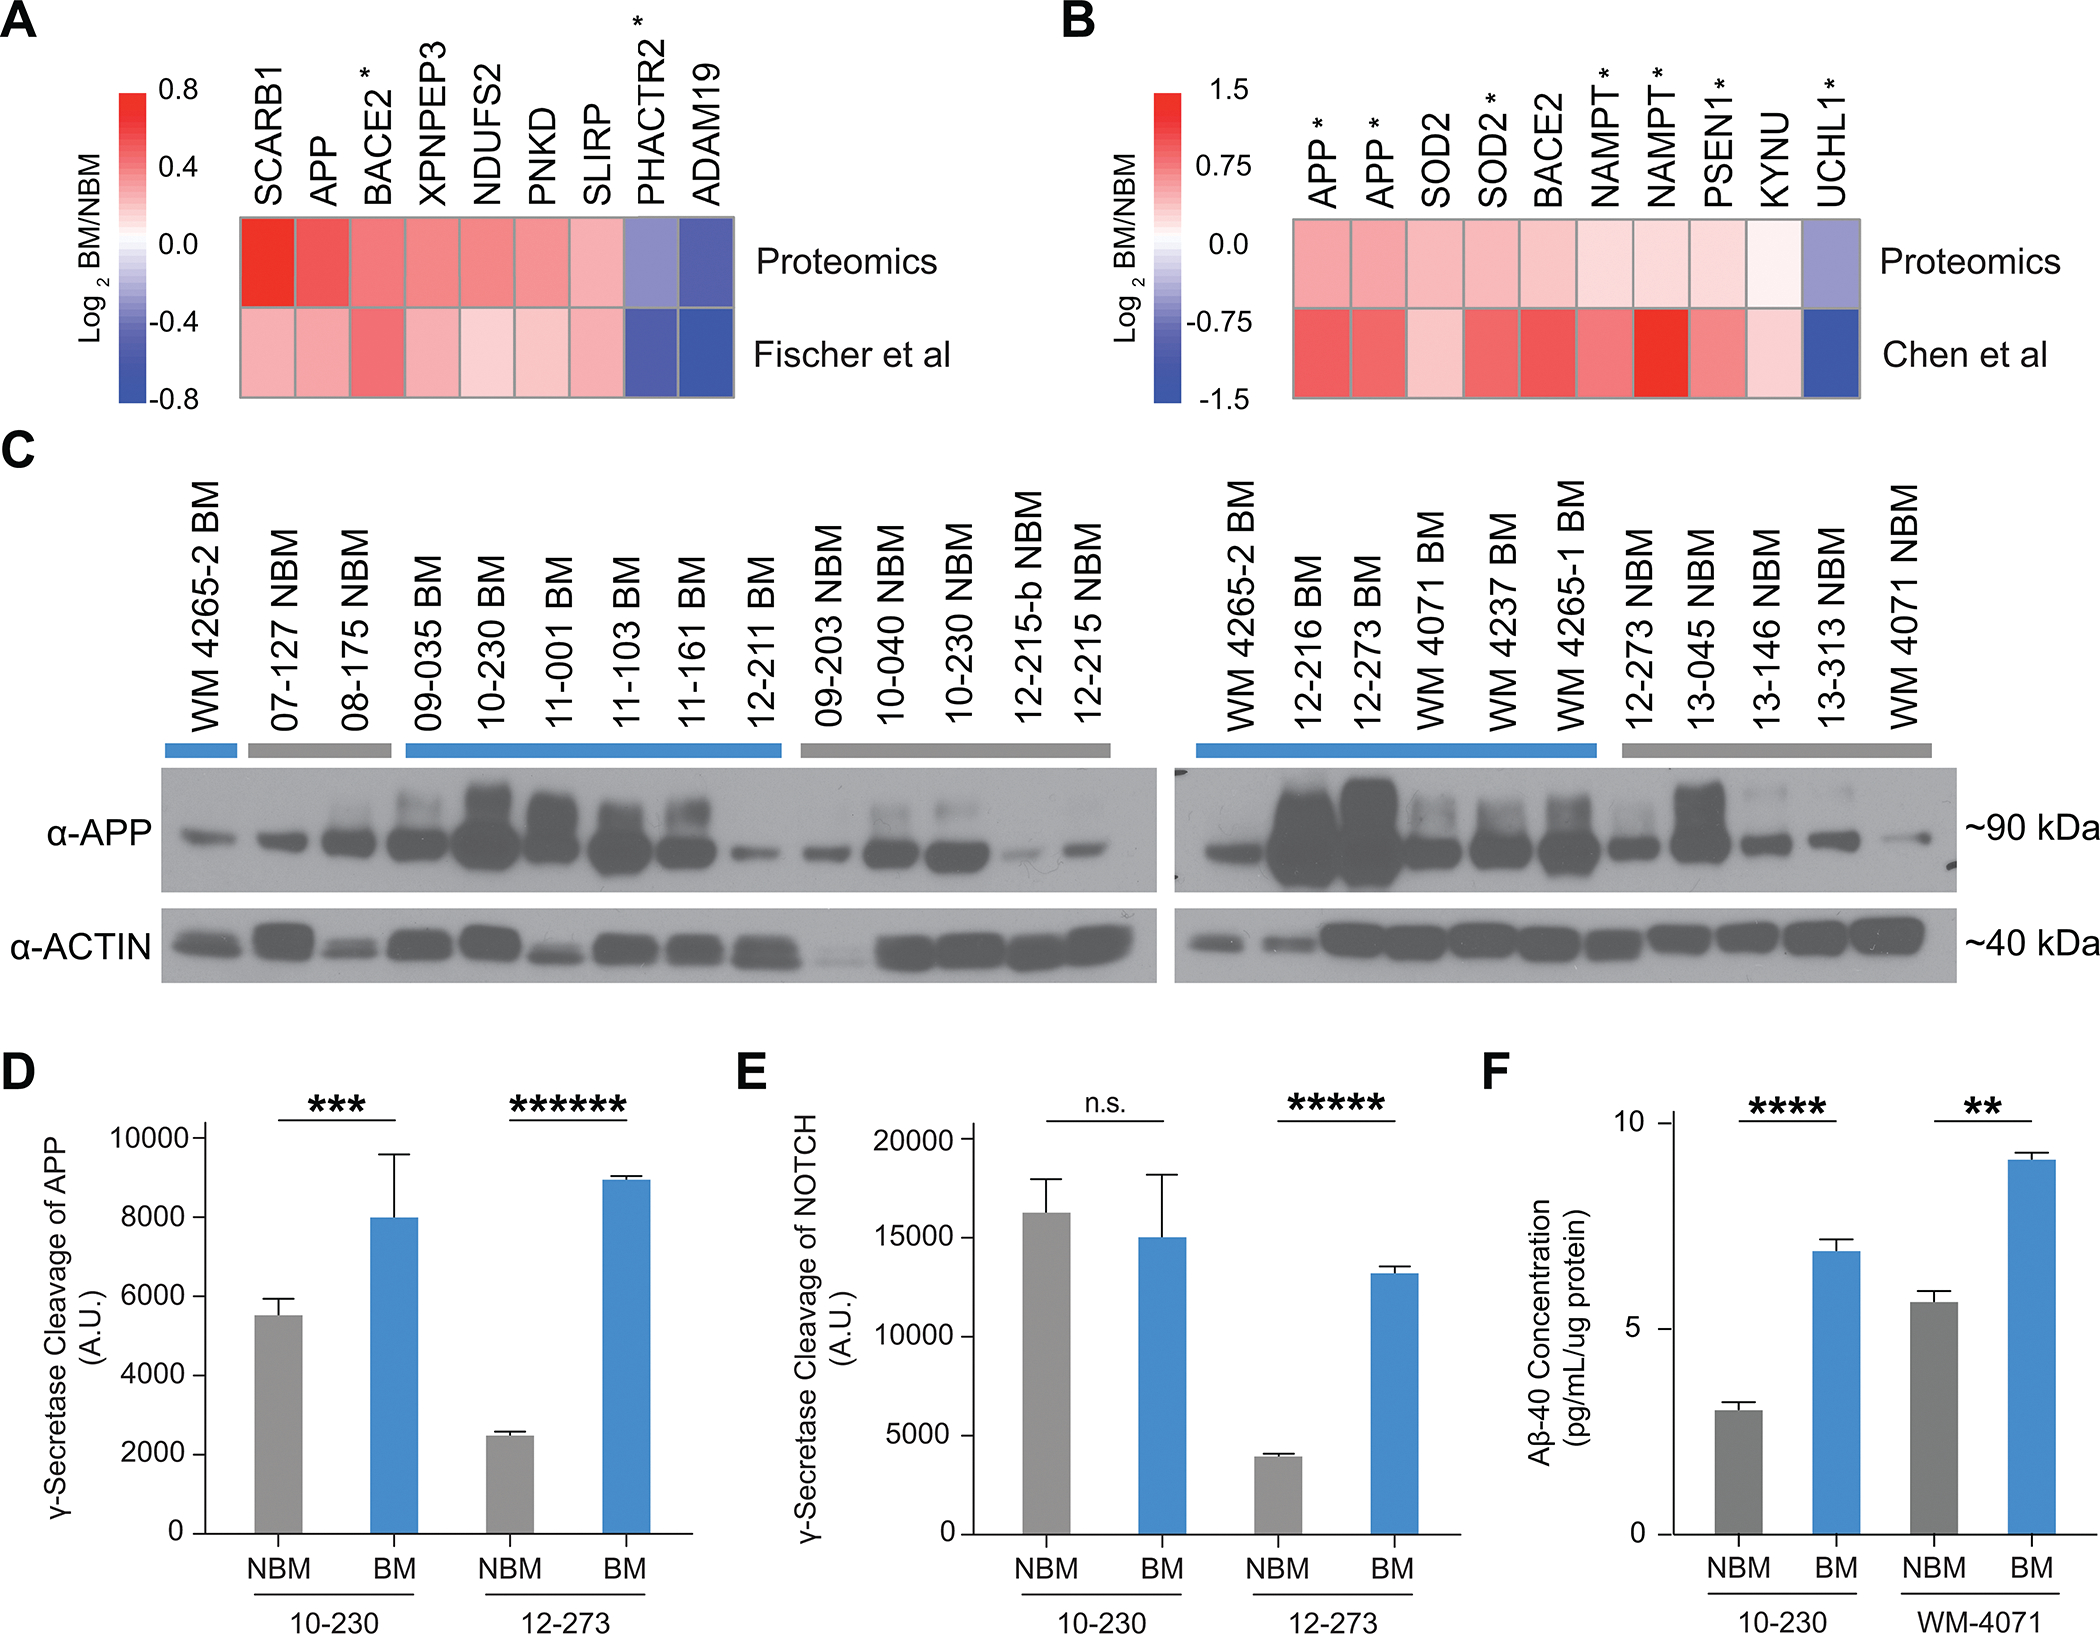
Figure 2.

Production of Aβ by Melanoma Cells is Associated with Brain Metastasis. A,B, Heatmap comparing unpaired Log 2 BM/NBM protein levels from proteomics dataset (Figure 1E–G) to Log 2 BM/NBM gene expression from previously published Fischer et al (20)(A) (EGA Accession #EGAS00001003672) and Chen et al (19) (B) (GEO Accession # GSE50496), respectively. * = p-value < 0.05 for BM vs NBM gene expression in Fischer et al (A) or Chen et al (B). C, Western blot analysis of APP (22C11) in full cohort of STCs (12 BM and 12 NBM). WM4265–2 included twice (once in each blot) for reference of signal across blots. D-E, Quantification of gamma-secretase cleavage of APP (D) and NOTCH (E) (n=4 biological replicates per group, representative experiment shown). D, APP cleavage. 10–230 NBM vs. BM (*** p<0.0005). E, NOTCH cleavage. 12–273 NBM vs BM (***** p<0.000005). F, Quantification of Aβ-40 secretion by ELISA (n=2–3 biological replicates per group). 10–230 NBM vs BM (**** p<0.00005), WM-4071 NBM vs BM (** p<0.005).
