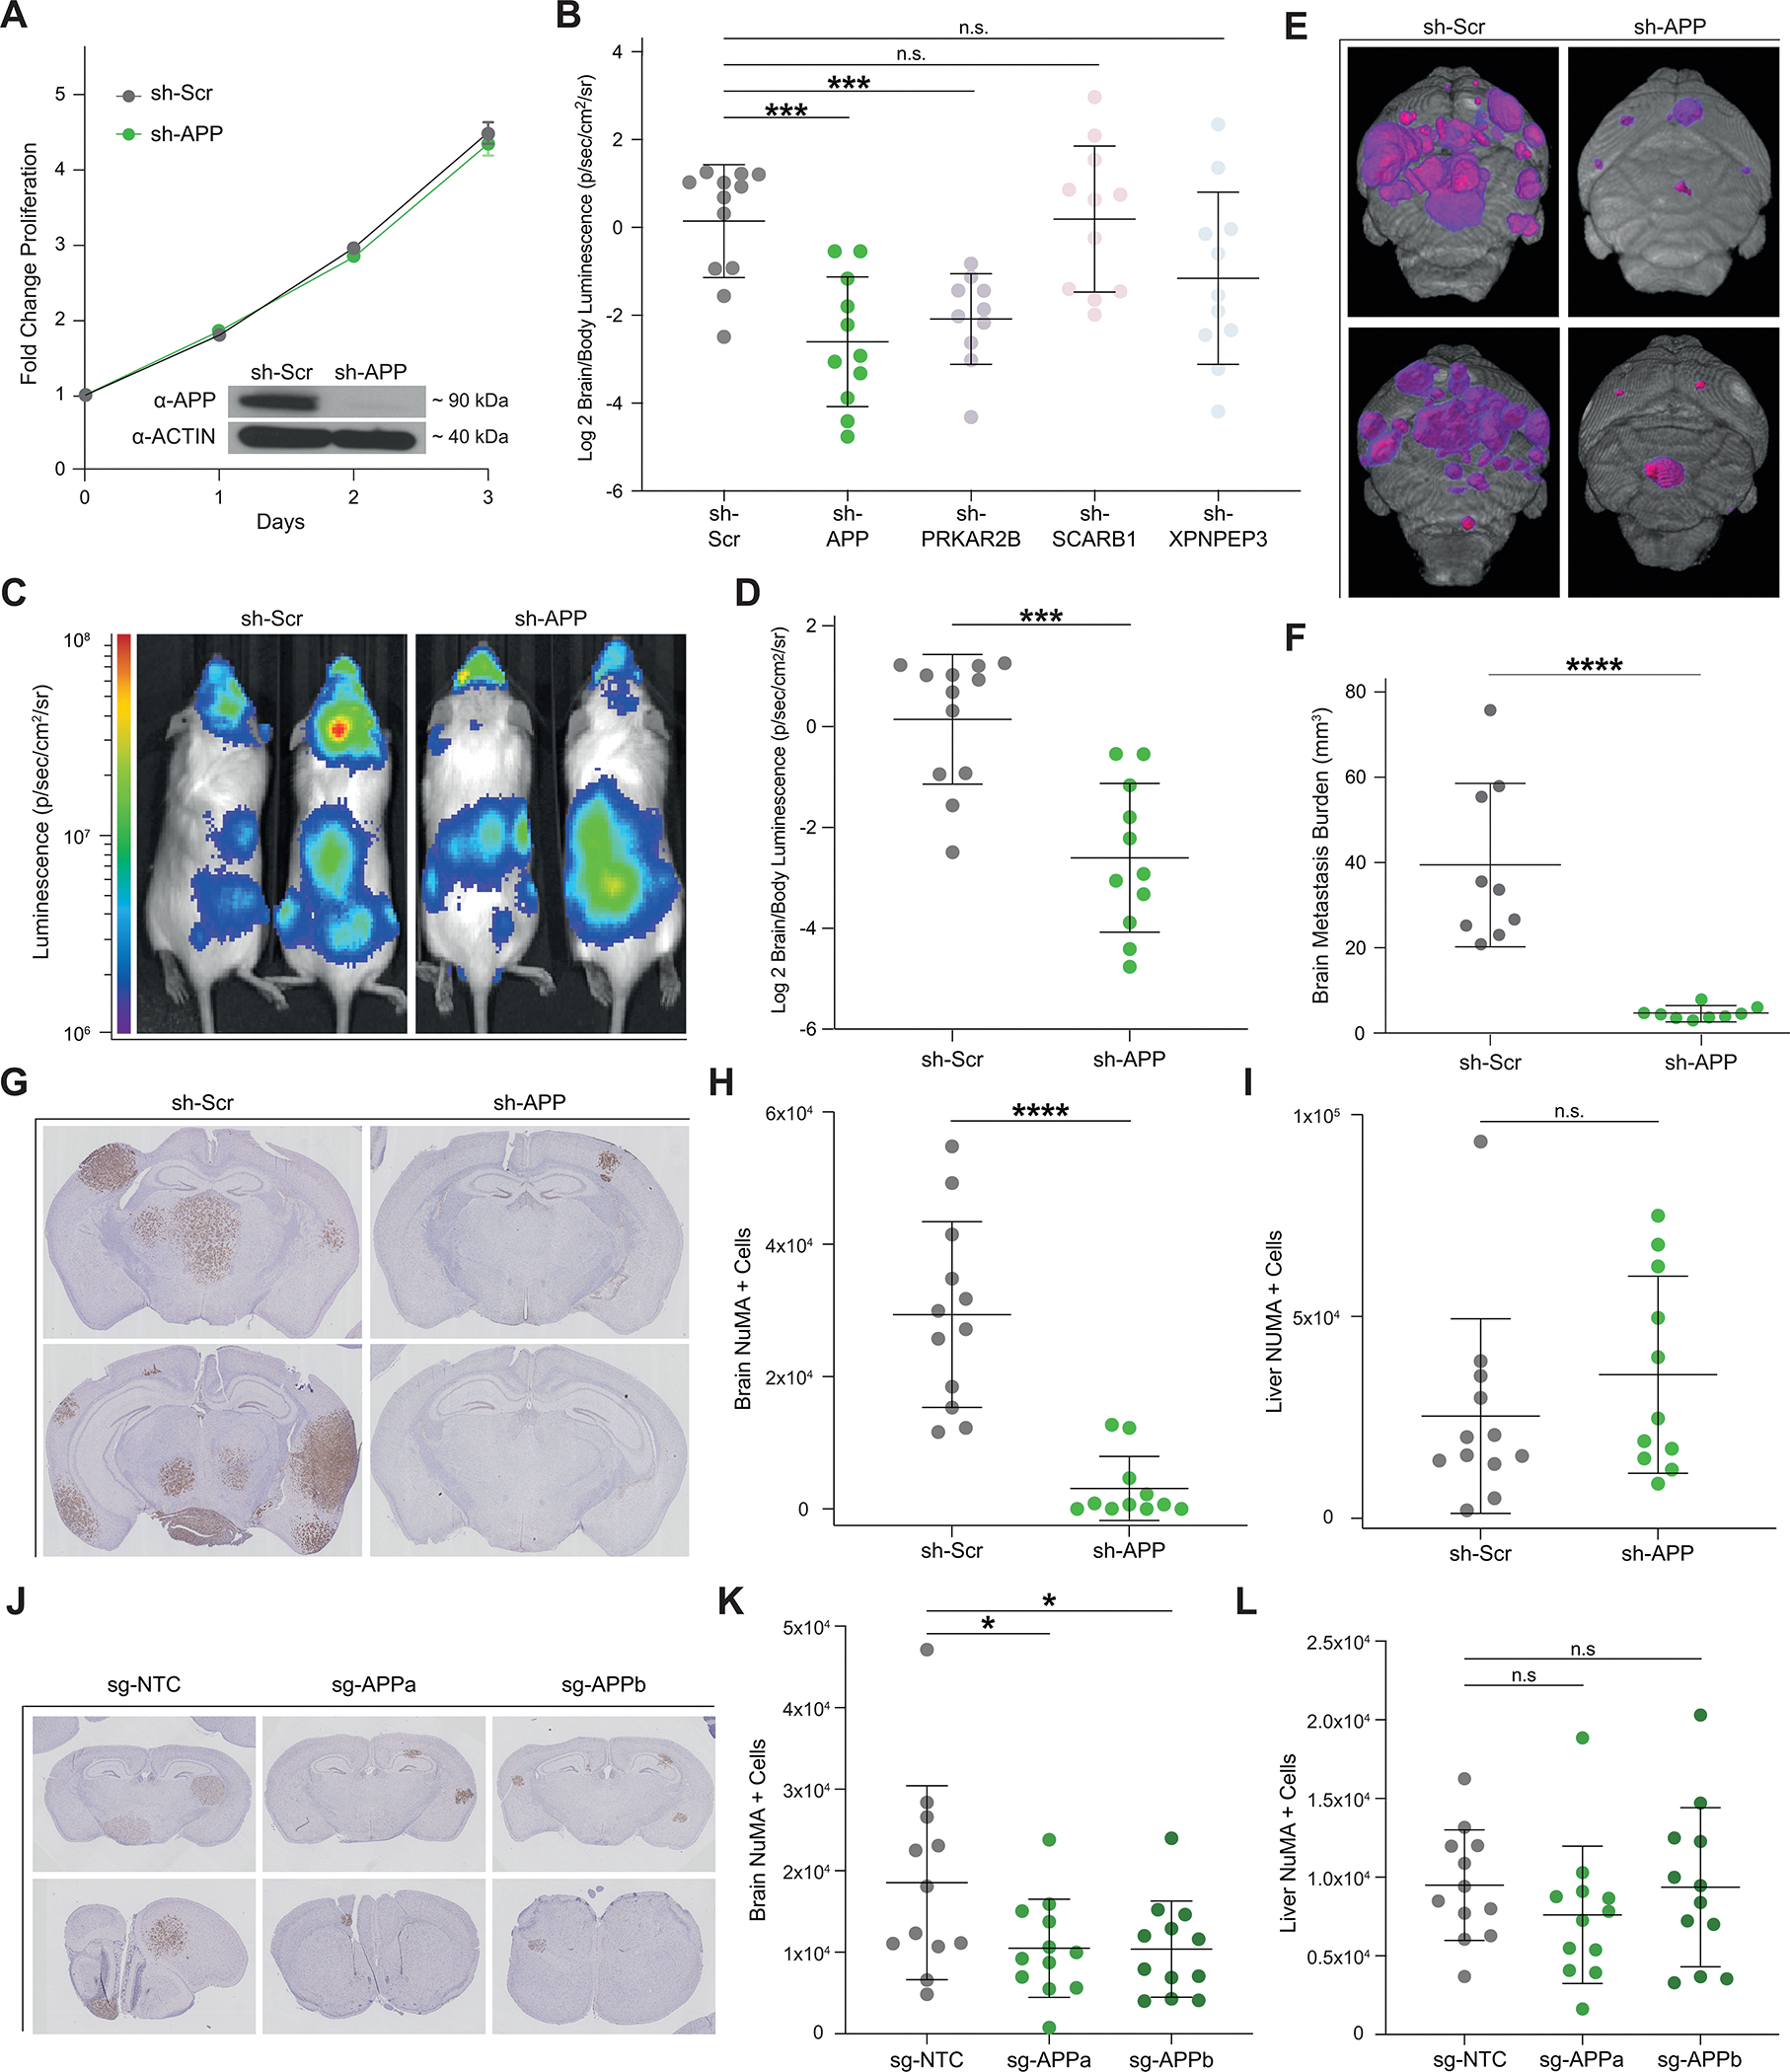
Figure 3.

APP is Specifically Required for Melanoma Brain Metastasis. A, In vitro proliferation curve and western blot analysis of 12–273BM cells transduced with sh-APP vs. sh-Scr. B, Quantified Log2 Brain/Body luminescence 35 days post intracardiac injection in NSG mice of 12–273 BM with shRNA-mediated silencing of selected candidates or scrambled hairpin control (sh-Scr) (10–12 NSG mice per group). sh-Scr vs. sh-APP (*** p<0.0005), sh-Scr vs. sh-PRKAR2B (*** p<0.0005). C, Representative IVIS images at day 35. D, Quantified Log2 Brain/Body luminescence at day 35 of mice injected with 12–273 BM cells transduced with sh-Scr vs. sh-APP lentivirus (*** p<0.0005). E-F, Ex-vivo brain MRI of mice injected with 12–273 BM sh-Scr vs. sh-APP (9 mice per group). E, Representative images. Pink-purple – brain metastasis. F, Quantification of brain metastatic burden by MRI. sh-Scr vs. sh-APP (**** p<0.00005). (G-I), Staining of metastatic cells by anti-NuMA immunohistochemistry on FFPE sections of mice injected with sh-Scr vs. sh-APP (10–12 NSG mice per group). G, Representative brain images. H-I, Quantification of NuMA+ metastatic cells in mouse brains (H), sh-Scr vs. sh-APP (**** p<0.00005), and livers (I). J-L, Staining of metastatic cells by anti-NuMA immunohistochemistry on FFPE brain sections of mice injected with 12–273 BM cells with CRISPR/Cas9 mediated knockdown using a non-targeting control single guide RNA (sg-NTC) or one of two single guide RNAs targeting APP (sg-APPa, sg-APPb) (11–12 mice per group). J, Representative brain images. K-L, Quantification of NuMA+ metastatic cells in mouse brains (K), sg-NTC vs. sg-APPa (* p<0.05) and sg-NTC vs. sg-APPb (* p<0.05), and livers (L).
