
Figure 6.
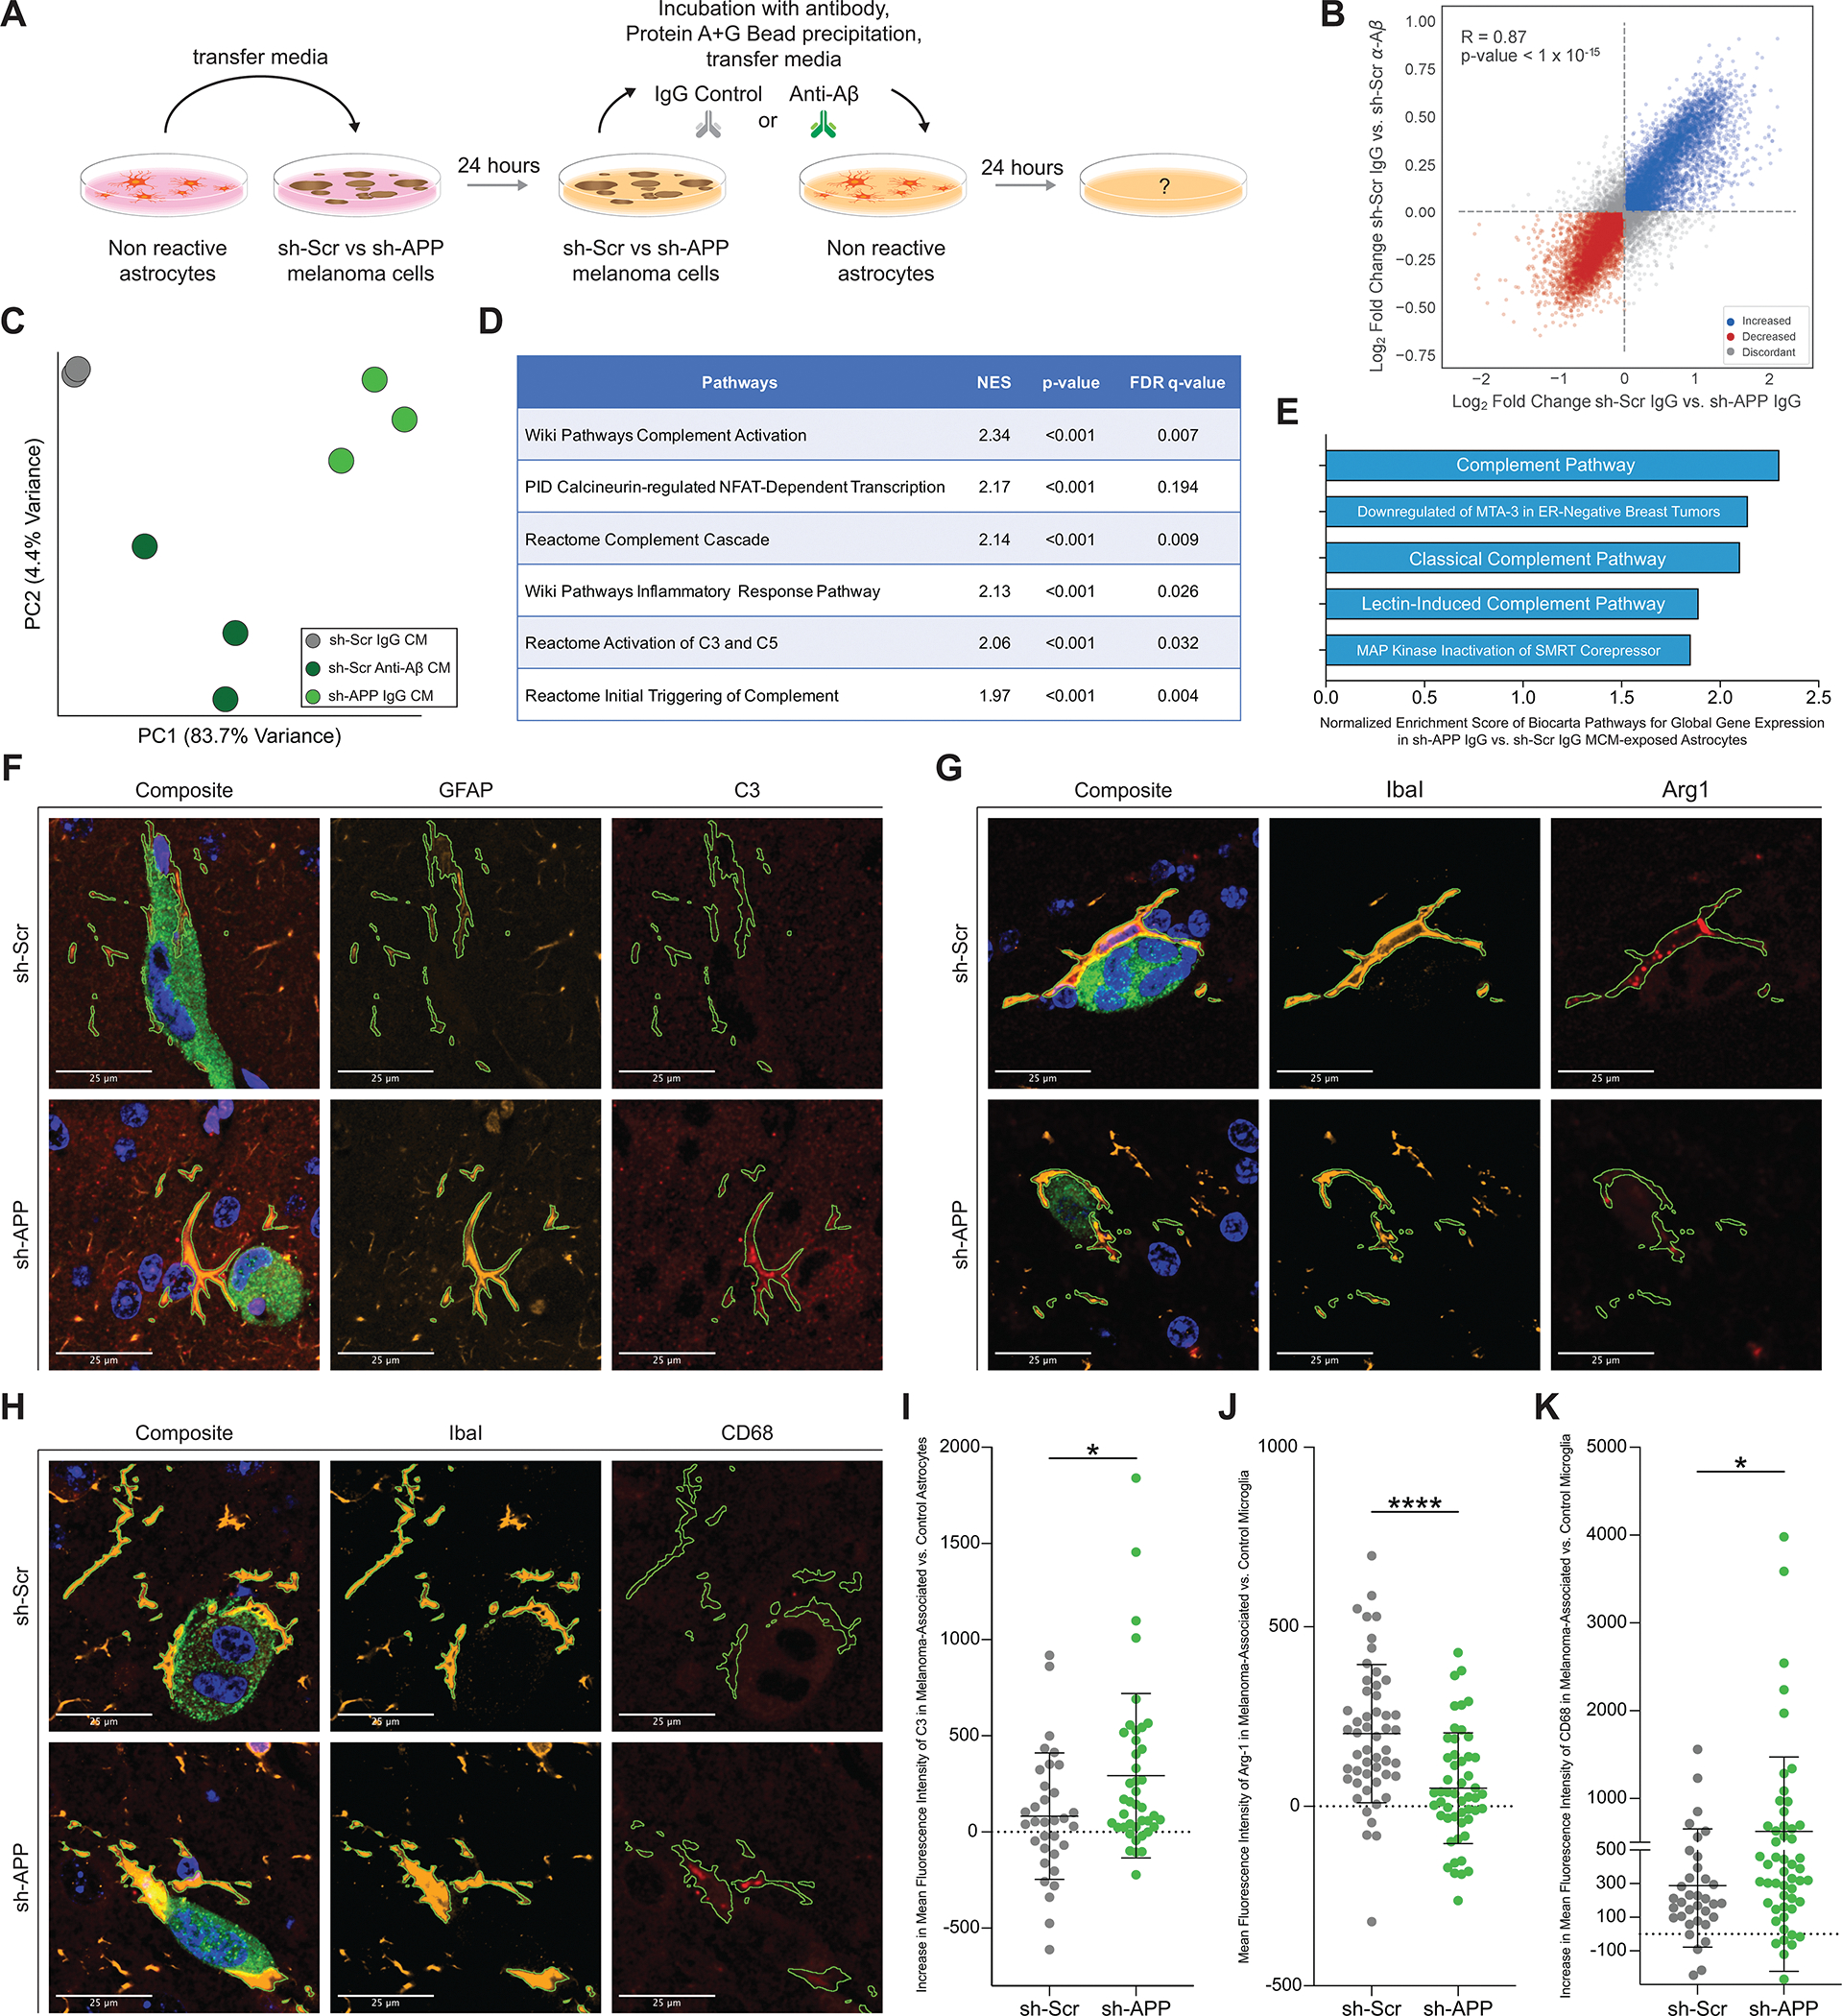
Melanoma-secreted Aβ suppresses inflammatory signaling in astrocytes and protects melanoma from microglial phagocytosis. A, Diagram of experimental method for exposing astrocytes to melanoma-conditioned media with and without Aβ (2–3 biological replicates per group, representative experiment shown B-E). B, Gene expression changes induced in astrocytes upon removal of Aβ from melanoma conditioned media (CM) by genetic silencing of APP in 12–273 BM melanoma cells (x axis – 12–273 BM sh-Scr IgG CM vs. sh-APP IgG CM) compared to changes induced by direct immunodepletion of Aβ from conditioned media (y axis – 12–273 BM sh-Scr IgG CM vs. sh-Scr Anti-Aβ CM). Correlation coefficient r=0.89 (p<1×10–15). C, Unsupervised principal component analysis of gene expression in astrocytes exposed to control melanoma-conditioned media. D, Selected pathways from Gene Set Enrichment Analysis found to be significantly enriched in 12–273 BM sh-APP IgG CM vs. sh-Scr IgG CM exposed astrocytes (NES=Normalized Enrichment Score, FDR=False Discovery Rate). E, Top five Biocarta pathways with the highest Normalized Enrichment Score in 12–273 BM sh-APP IgG CM vs. sh-Scr IgG CM exposed astrocytes. F-H, Representative images of brain slice immunofluorescence at day 10 post intracardiac injection (12–273 BM, 3 mice per group). Fluorescent Markers: green = anti-GFP (melanoma cells), blue = DAPI (nuclei), orange = anti-GFAP (F, astrocytes) or anti-Iba1 (G-H, microglia), red = Complement-3 (F) or Arginase-1 (G) or CD68 (H). I, 3D-quantification of mean fluorescence intensity of Complement-3 in melanoma-associated vs. control astrocytes. 12–273 BM sh-Scr vs. sh-APP (* p<0.05). J, 3D-quantification of mean fluorescence intensity of Arginase-1 in melanoma-associated vs. control microglia. 12–273 BM sh-Scr vs. sh-APP (* p<0.00005). K, 3D-quantification of mean fluorescence intensity of CD68 in melanoma-associated vs. control microglia. 12–273 BM sh-Scr vs. sh-APP (* p<0.05).