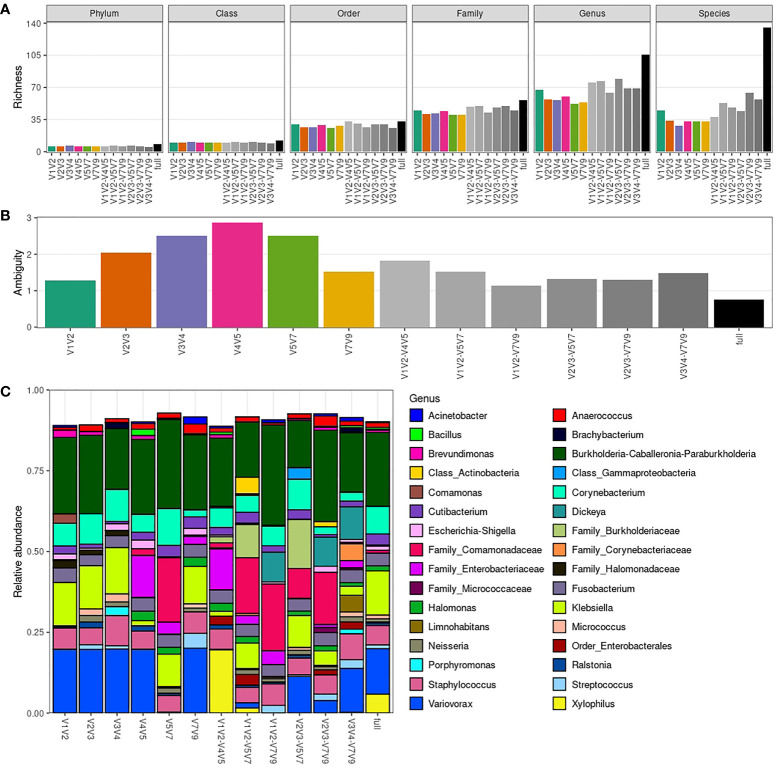
Figure 4.
Richness and taxonomic composition of Sidle-reconstructed datasets. (A) Taxonomic richness (phylum to species level) per amplicon-specific or Sidle-reconstructed dataset. (B) Ambiguity in taxonomic assignment per amplicon-specific or Sidle-reconstructed dataset. (C) Average genera relative abundance per amplicon-specific or Sidle-reconstructed dataset. Only the 32 most abundant genera are shown (based on minimum relative abundance in at least one sample, which is adjusted for each plot).

