
Fig. 2.
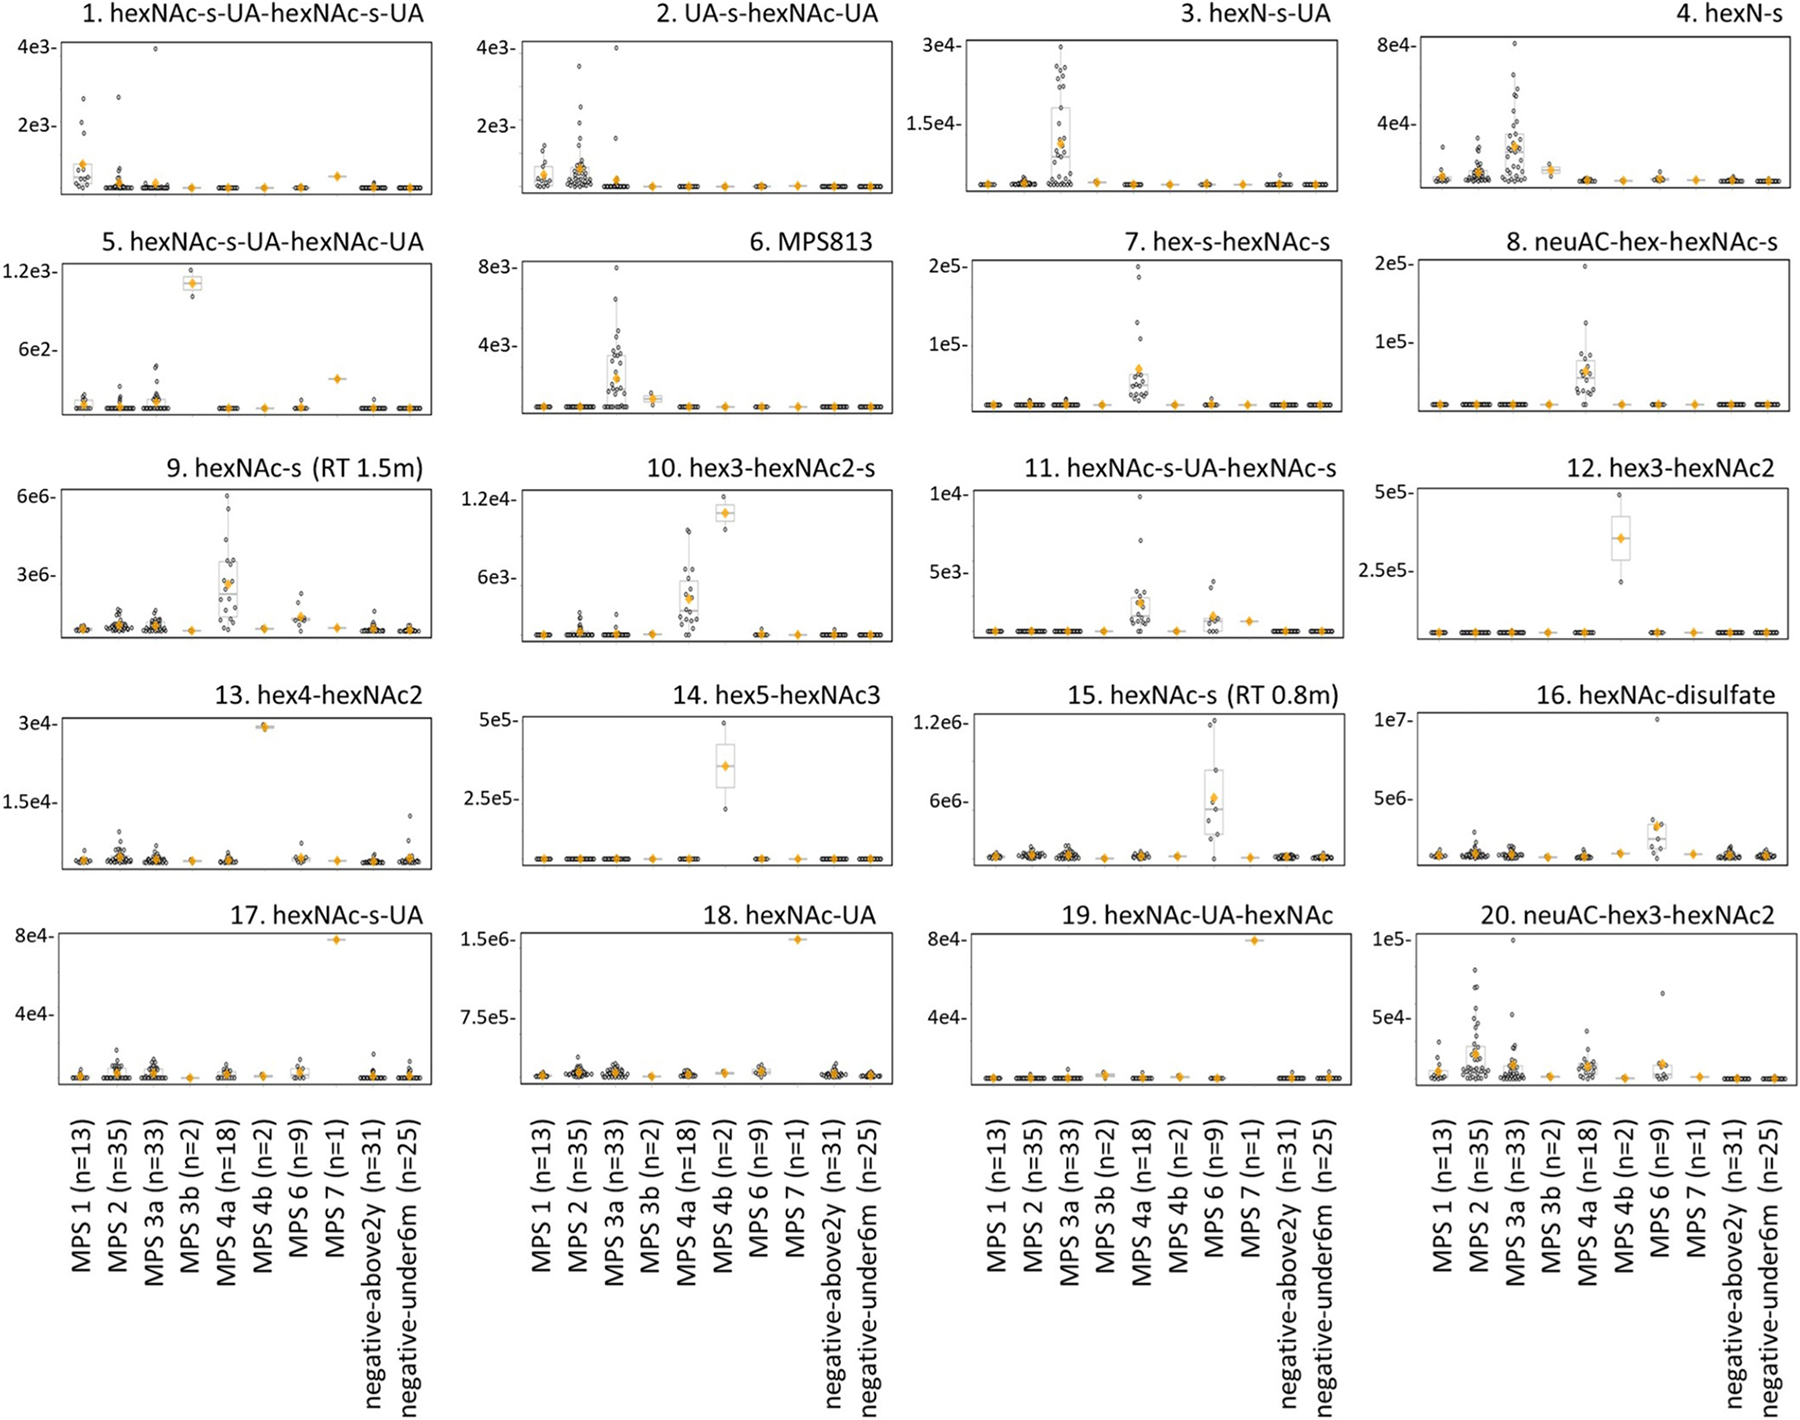
Verification of urinary biomarker findings for mucopolysaccharidoses by LC-MS/MS. Mucopolysaccharidosis urine samples (n = 113) used for biomarker discovery were re-analyzed using the targeted LC-MS/MS panel. The boxplots show biomarker peak areas (y-axis) with individual data points and are grouped by each condition (x-axis). Each dot represents one sample, the orange diamond indicates the group mean, and the horizontal divider inside the boxplot indicates the group median. Ages used for the negative population were under 6 months of age (negative-under6m) and above 2 years of age (negative-above2y). Retention time, RT.