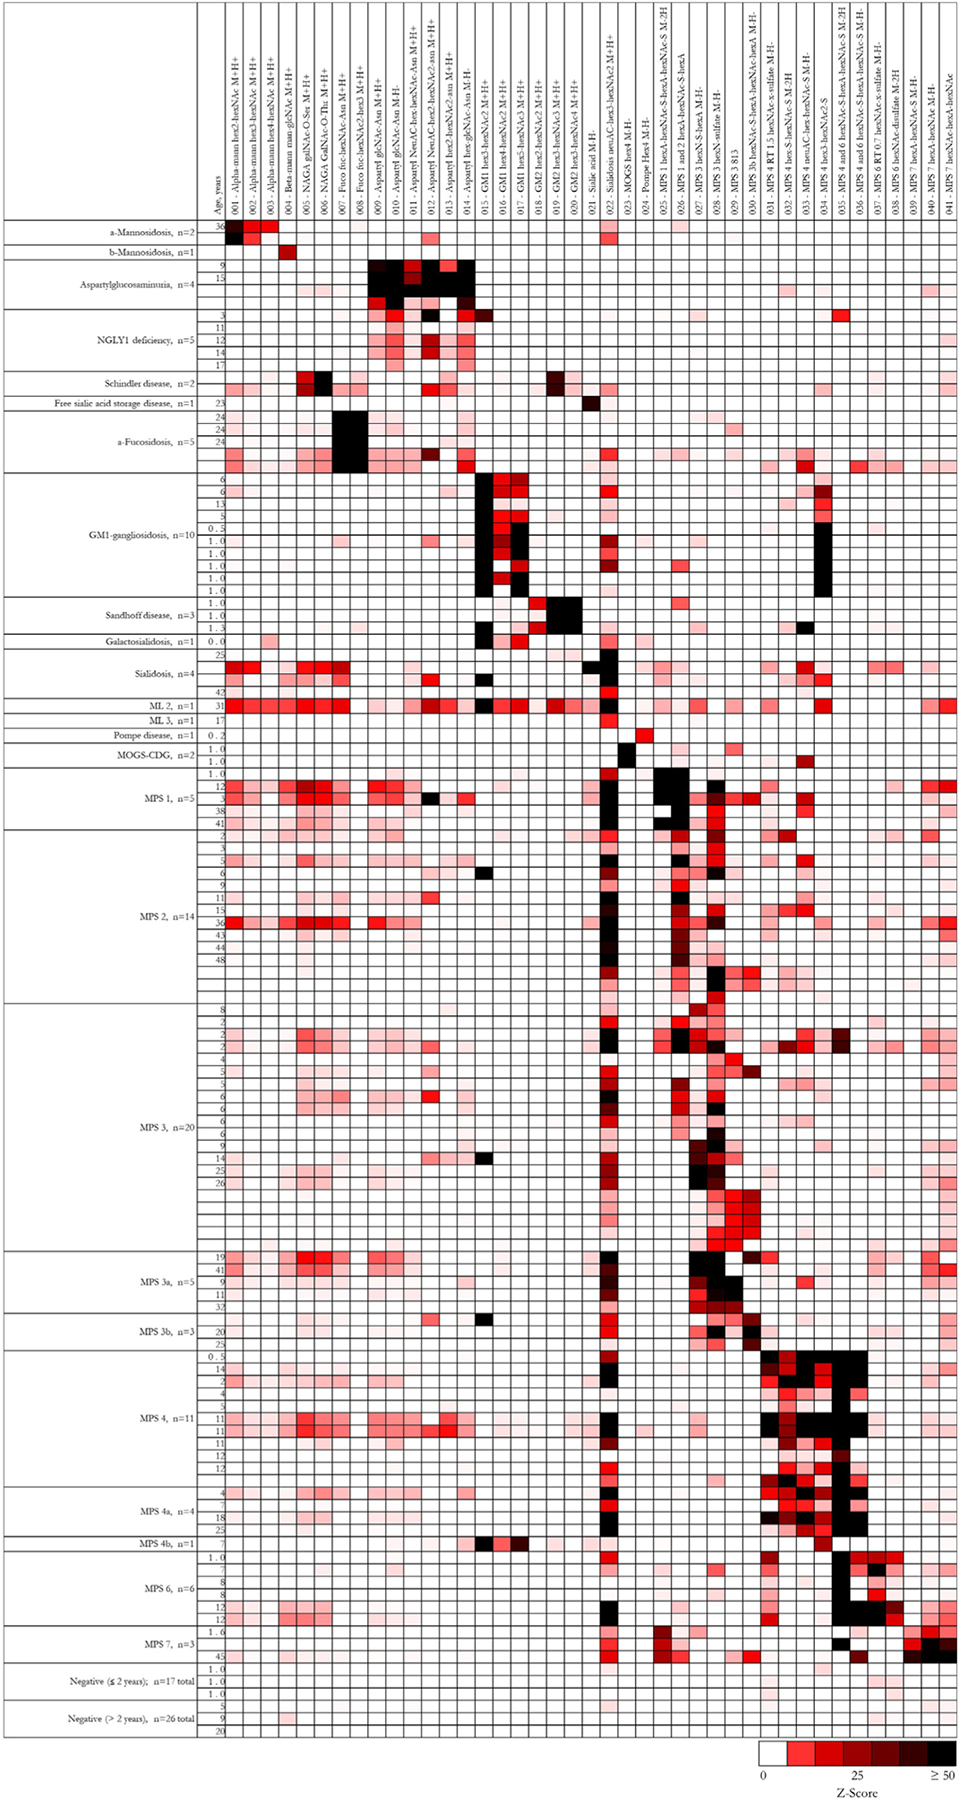
Fig. 3.

Heatmap of characteristic urinary biomarker profiles. For clinical test validation, previously untested urine samples were analyzed on the targeted LC-MS/MS panel. For each individual sample (horizontal), Z-scores for each biomarker (vertical) were generated using peak areas normalized by creatinine concentration. Relative biomarker abundances are defined according to the color-scale, with white squares representing normal biomarker levels, red squares representing abnormal biomarker levels, and black squares representing the highest degree of abnormality. For samples without age information, Z-scores were generated using the reference statistics from the older-age reference population. Specific subtypes of MPS 3 and 4 were confirmed by genetic or enzymatic testing. For each age range, three representative negative samples are shown. A total of 43 negative samples were evaluated.
