Figure 3.
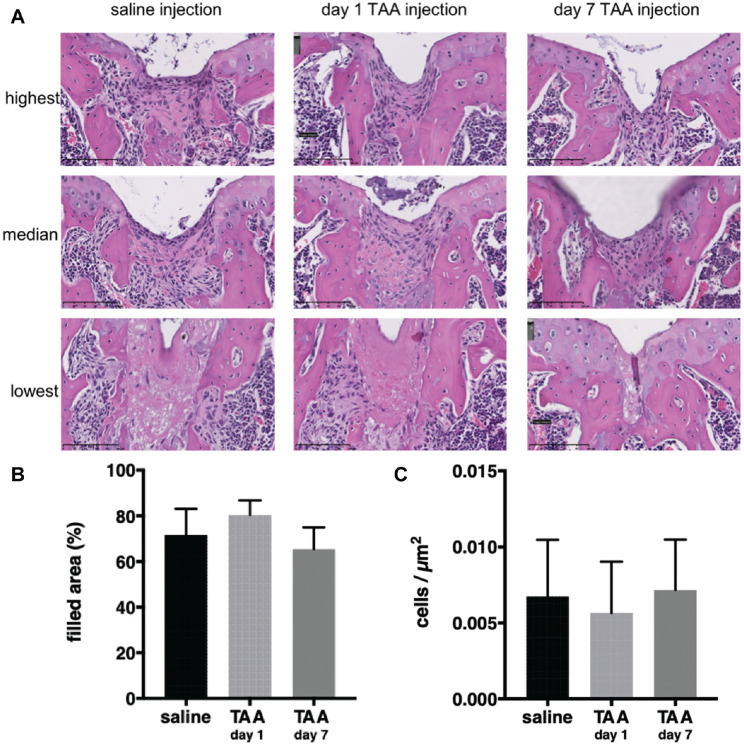
Cellularity was not affected by triamcinolone acetonide (TAA). (A) Representative images of the highest, median, and lowest cell density in the defect at day 10 stratified per group. (B) Area filled relative to the original size of the defect. (C) Number of cells per µm 2 . Each bar represents the mean ± SD of all defects in the respective group. n = 11-12 mice per group.

