
Figure 1. Differentially expressed gene (DEG) analysis between 9- and 26-month-old IHCs.
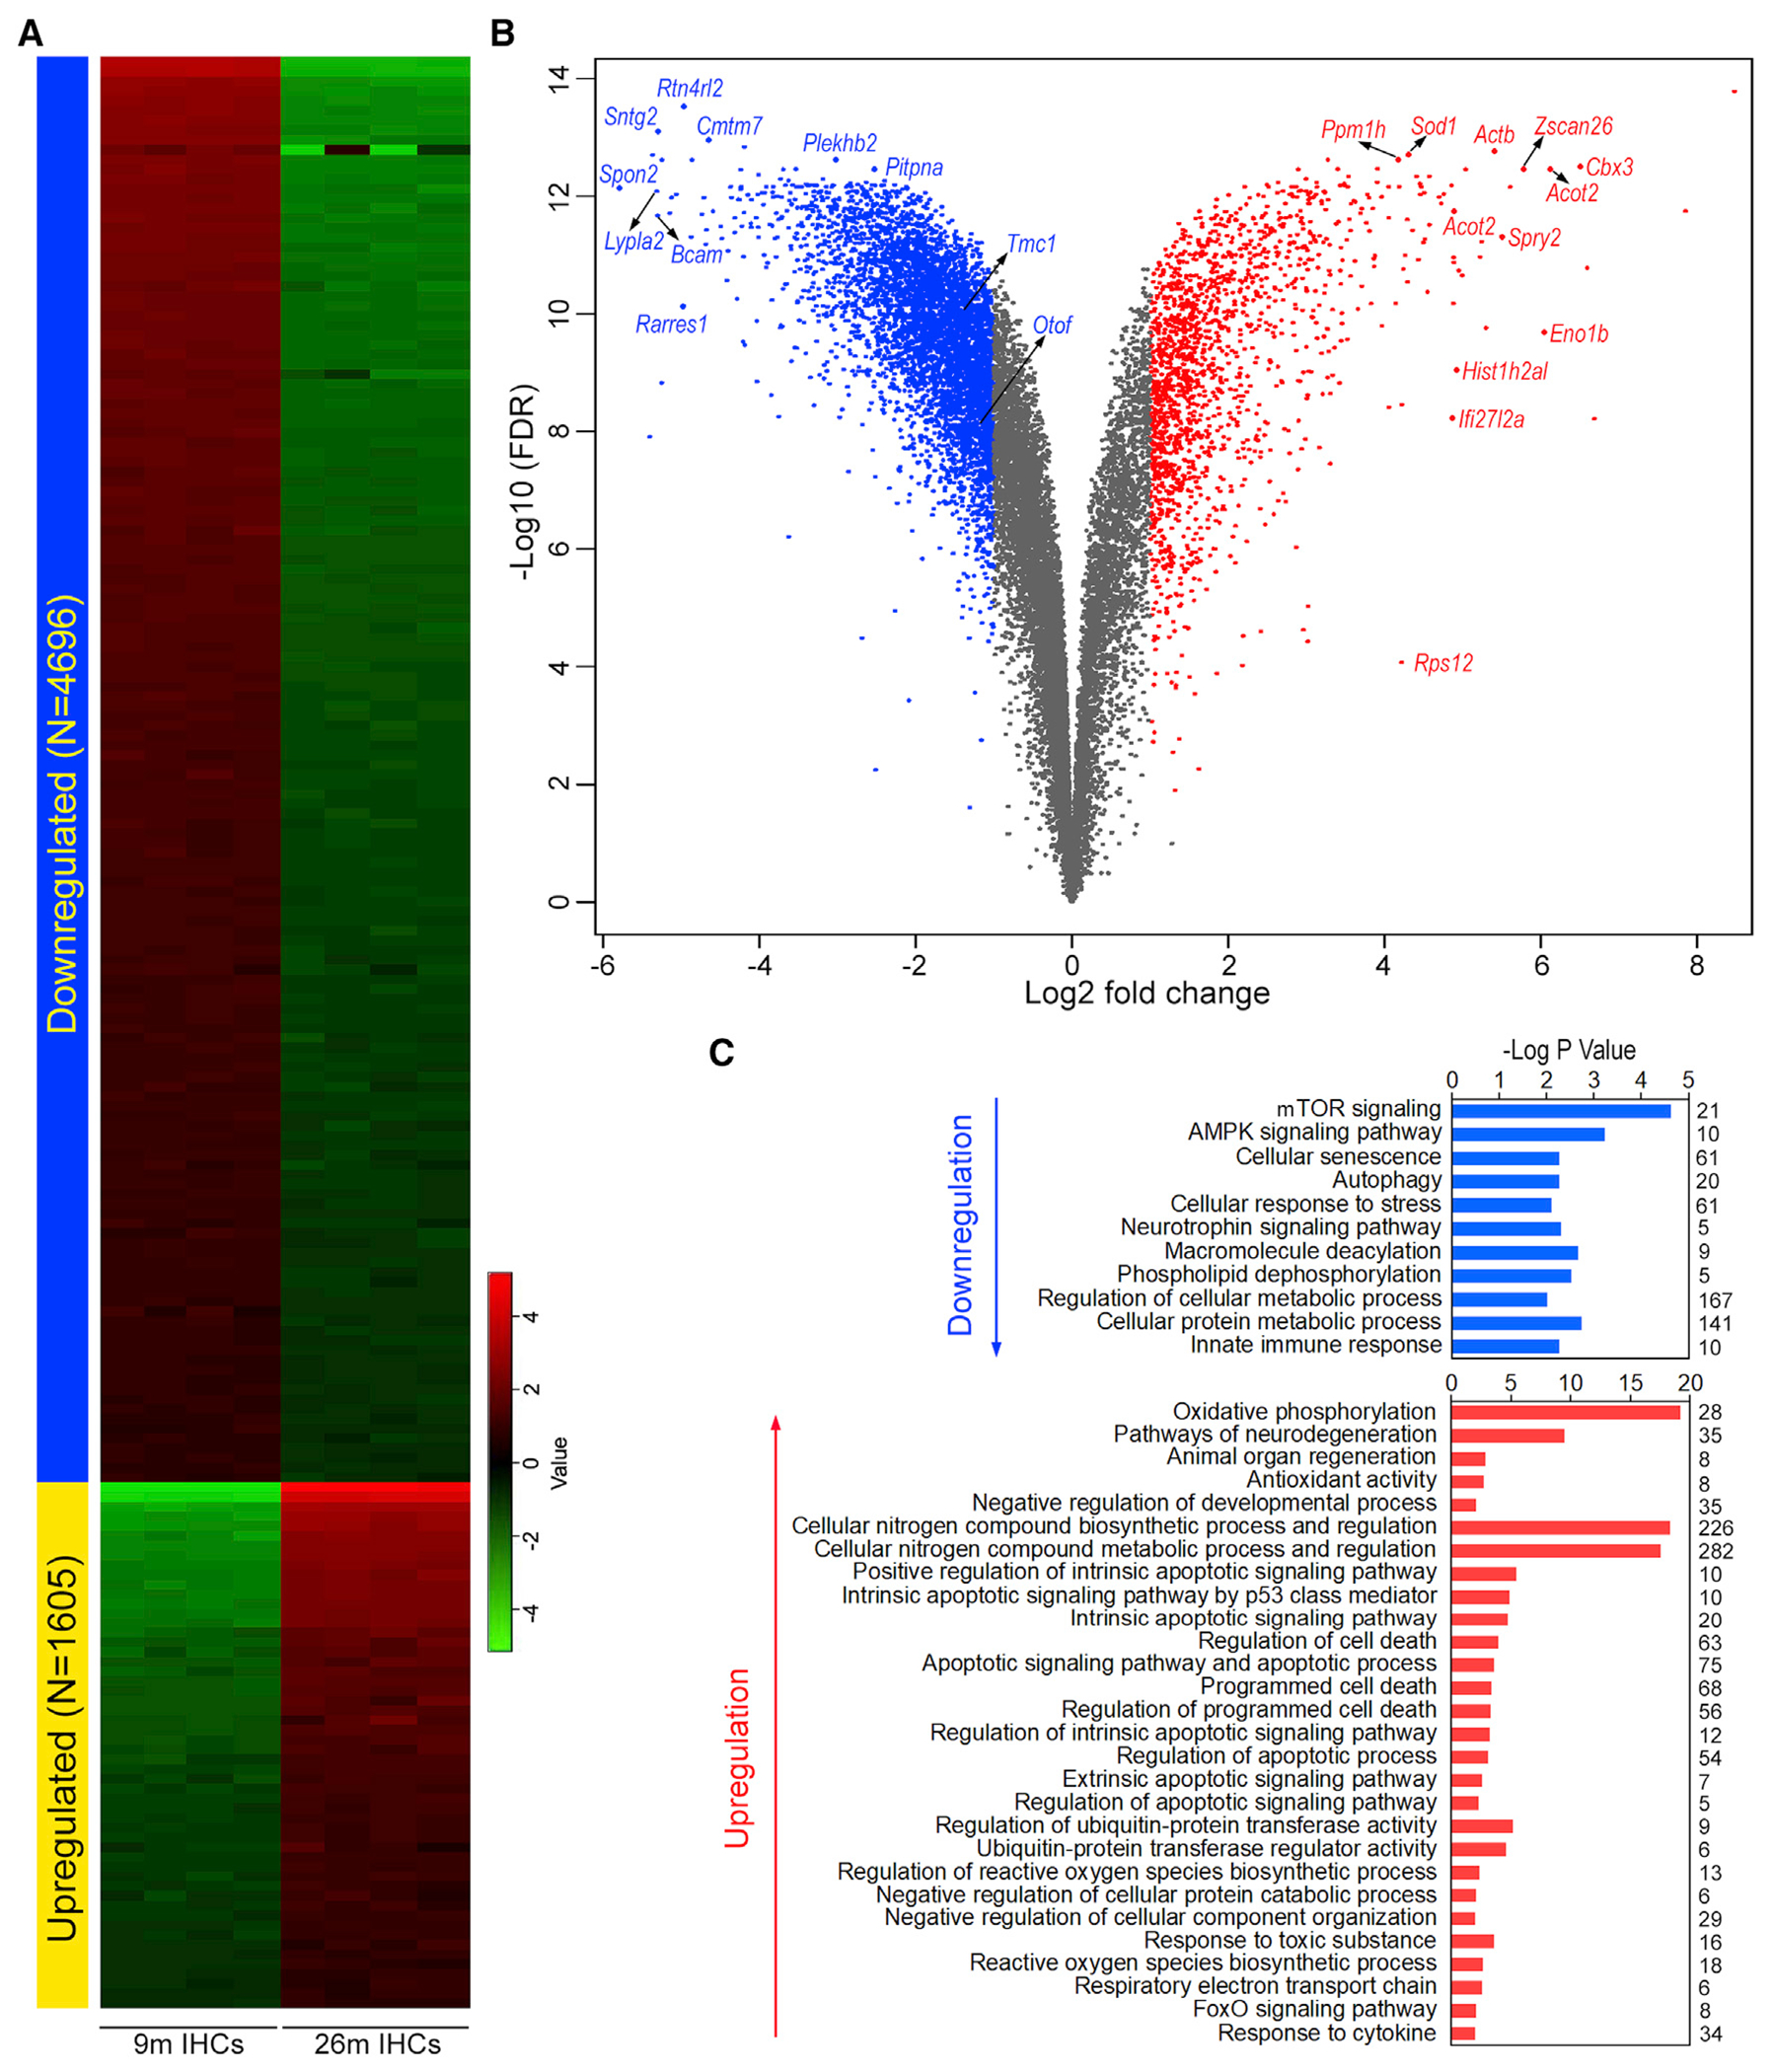
(A) Heatmap of differentially expressed genes.
(B) Volcano plot of DEGs. Some of the top differentially expressed genes as well as several genes known to be related to HC function are indicated.
(C) Gene set enrichment analysis of biological processes involving the top 500 up- and downregulated genes. Numeric value on the right of the panel represents the number of genes in each category.