
Figure 5. Change in gene expression during aging.
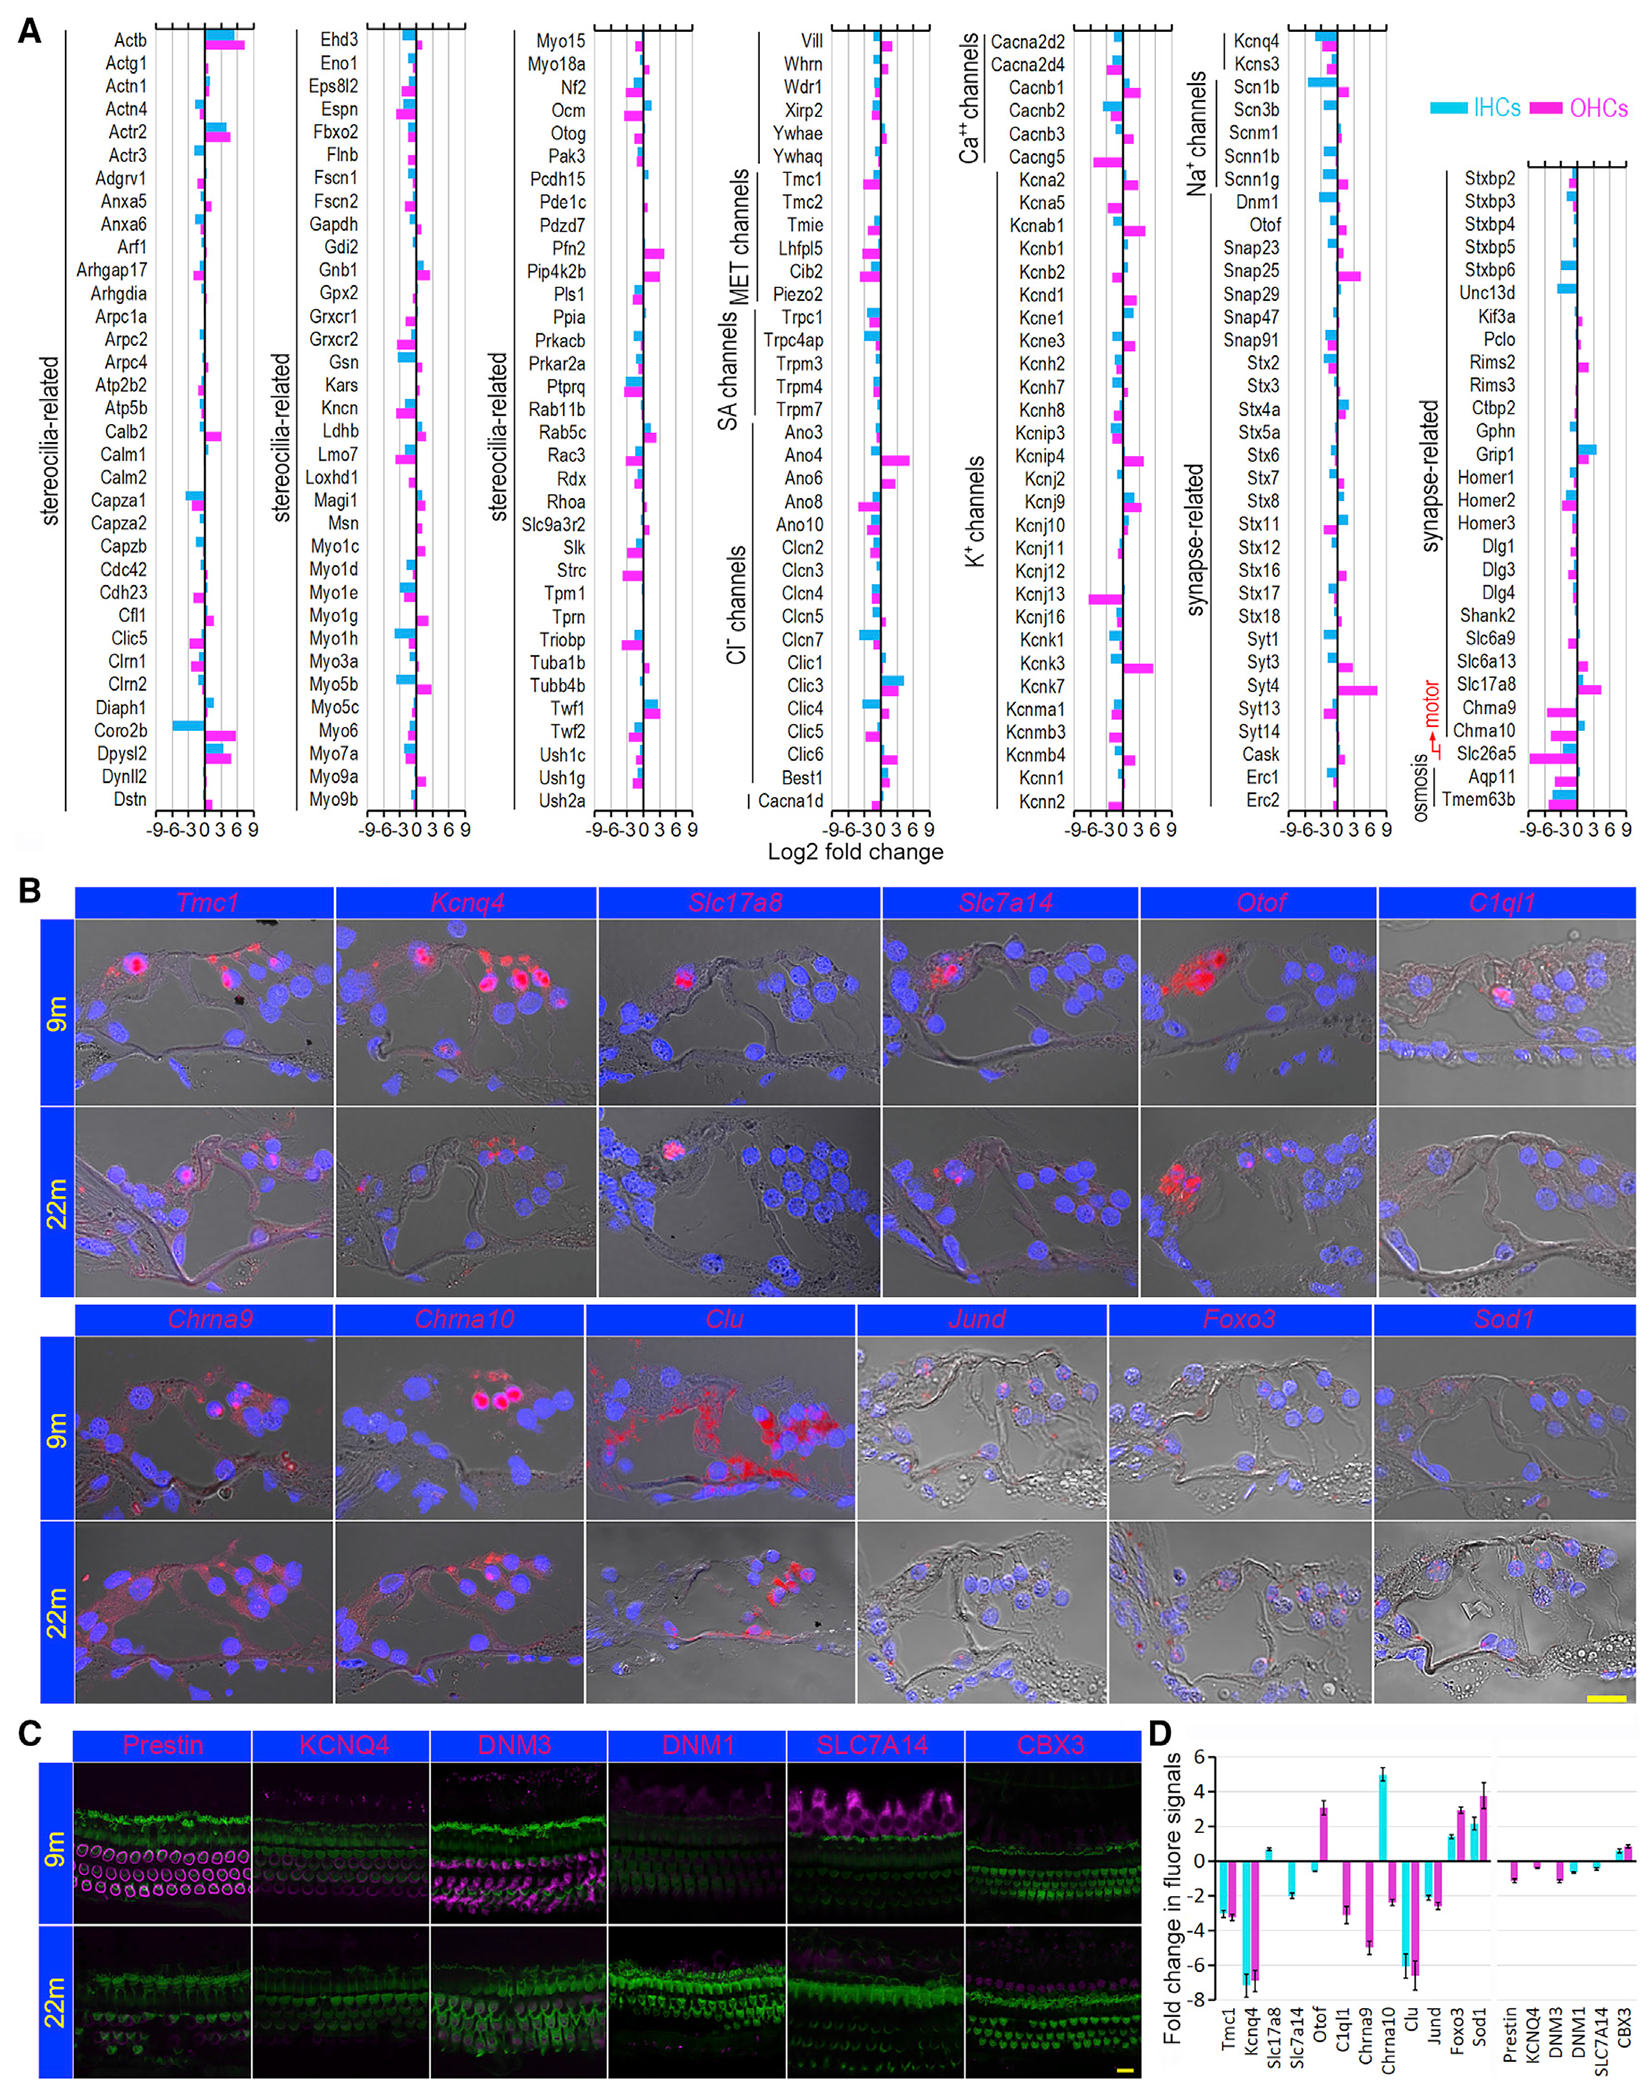
(A) Age-related change in expression of genes that are relate to specializations in IHCs and OHCs at 9 and 26 months. MET channels: mechanotransduction channels; SA channels: stretch activated channels.
(B) Validation of change in gene expression in aging HCs using smFISH. Red signals represent the labeled mRNA transcripts (gene expression), and the nuclei were stained with DAPI (blue).
(C) Validation of change in protein expression using immunostaining. Scale bars in (B) and (C) are 10 μm.
(D) Mean log2 fold change in fluorescent signal (integrated density) between 9- and 22-month-old HCs (bar: ± SD) using 9 months as a baseline. Six sections from three cochleae, aged 9 or 22 months, were used for smFISH quantitative analysis. For immunostaining, whole mount preparations from three cochleae at each age were used for quantification.