
Figure 6. Morphological changes of HCs during aging.
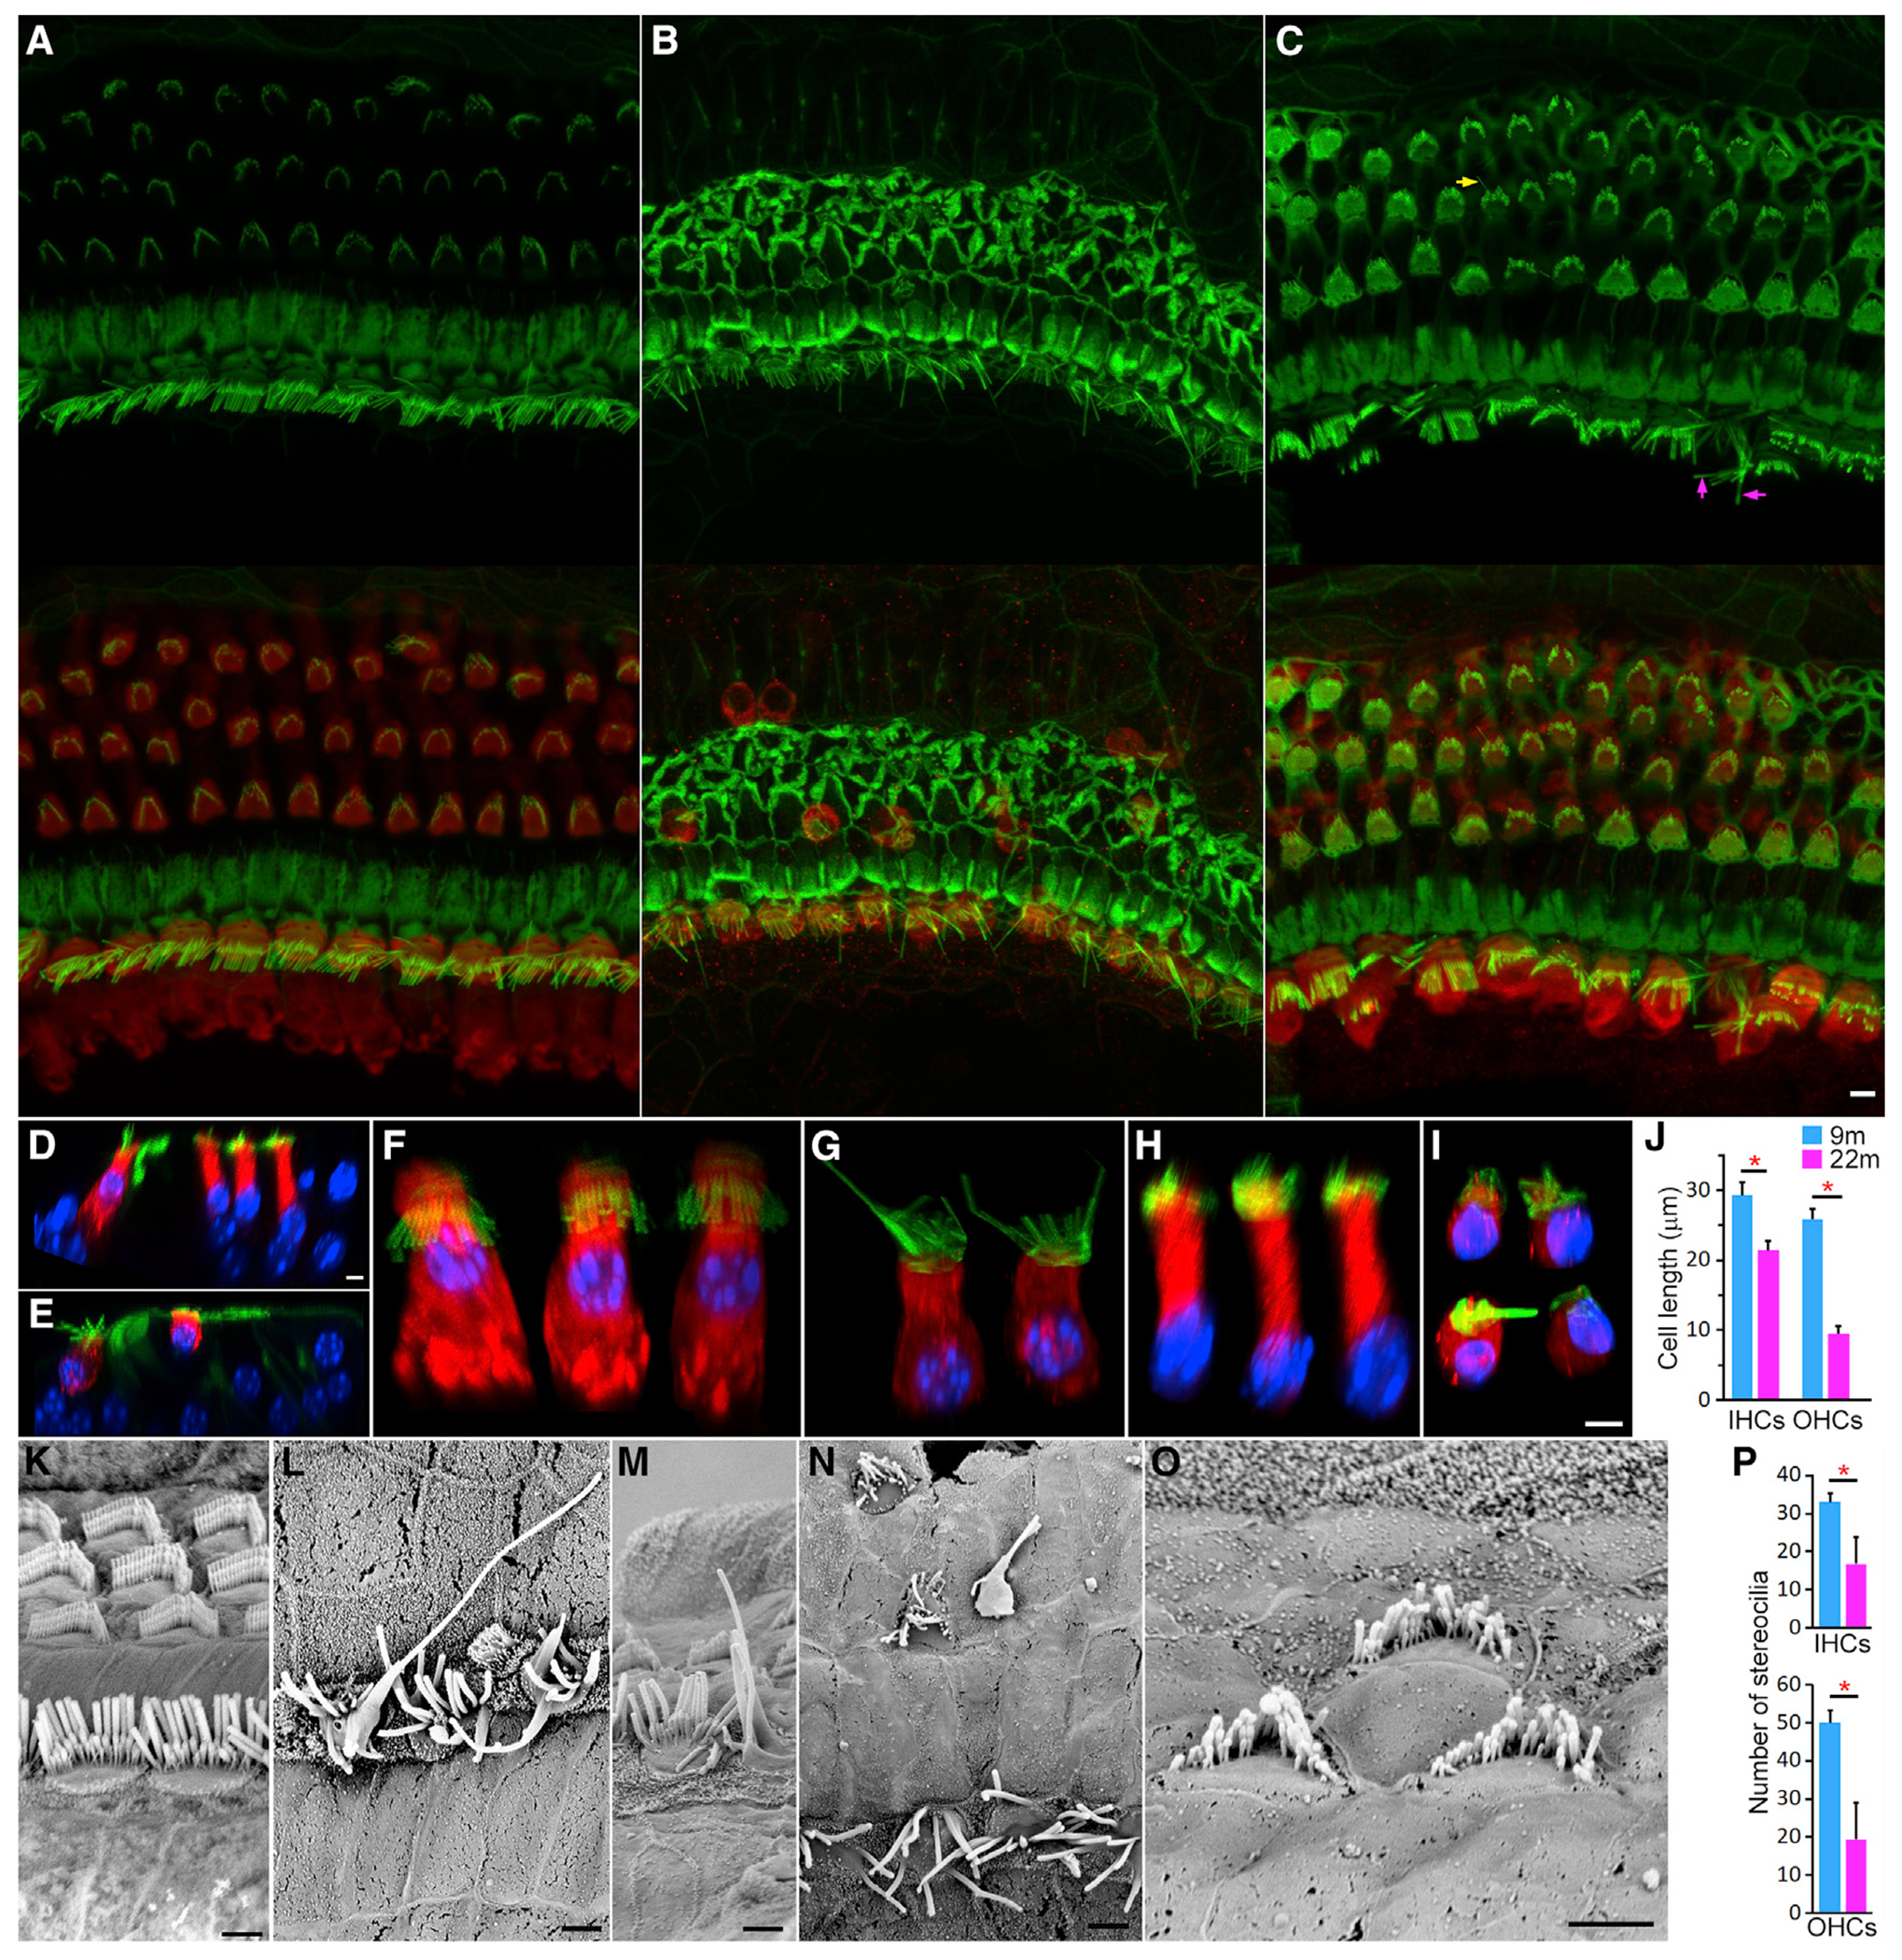
(A) Confocal image of HCs 500 μm from the apical end of a 9-month-old cochlea.
(B and C) Confocal images of HCs at cochlear locations 500 μm (B) and 1,800 μm (C) from the apical end of 22-month-old cochlea. Stereocilia were labeled with phalloidin (top panels), and HCs were stained with MYO7A (merged in bottom panels). Elongating stereocilia are marked with arrows in (C). Bar: 5 μm.
(D) Cross-section of the organ of Corti from 9-month-old cochlea using confocal virtual sectioning.
(E) Confocal optical section from 22-month-old cochlea.
(F and G) Images of individual IHCs at 9 months (F) and 26 months (G).
(H and I) Images of virtual individual OHCs at 9 months (H) and 22 months (I). Images were obtained from z stacked confocal images, following rotation of the image and manual removal of adjacent HCs and supporting cells in the background using Photoshop.
(J) Mean resting cell length of IHCs and OHCs at 9 and 22 months (±SD, n = 22 for IHCs and 27 for OHCs; three mice for each age). Red asterisk marks statistical significance between the two age groups (p = 8.8E-11 and 2.0E-42 for IHCs and OHCs, respectively).
(K) SEM micrograph of stereocilia bundles of the apical turn HCs at 9 months. Bar: 2 μm.
(L–O) SEM micrographs of degenerating stereocilia bundles (some are highlighted in purple) at 22 months. Bars: 2 μm.
(P) Comparison of the number of stereocilia of IHCs and OHCs between 9 and 22 months. Red asterisk marks statistical significance between the two age groups (p = 4.3E-07 and 2.7E-09 for IHCs and OHCs, respectively).