
Figure 7. Examples of NLC response and axial stiffness measured from OHCs.
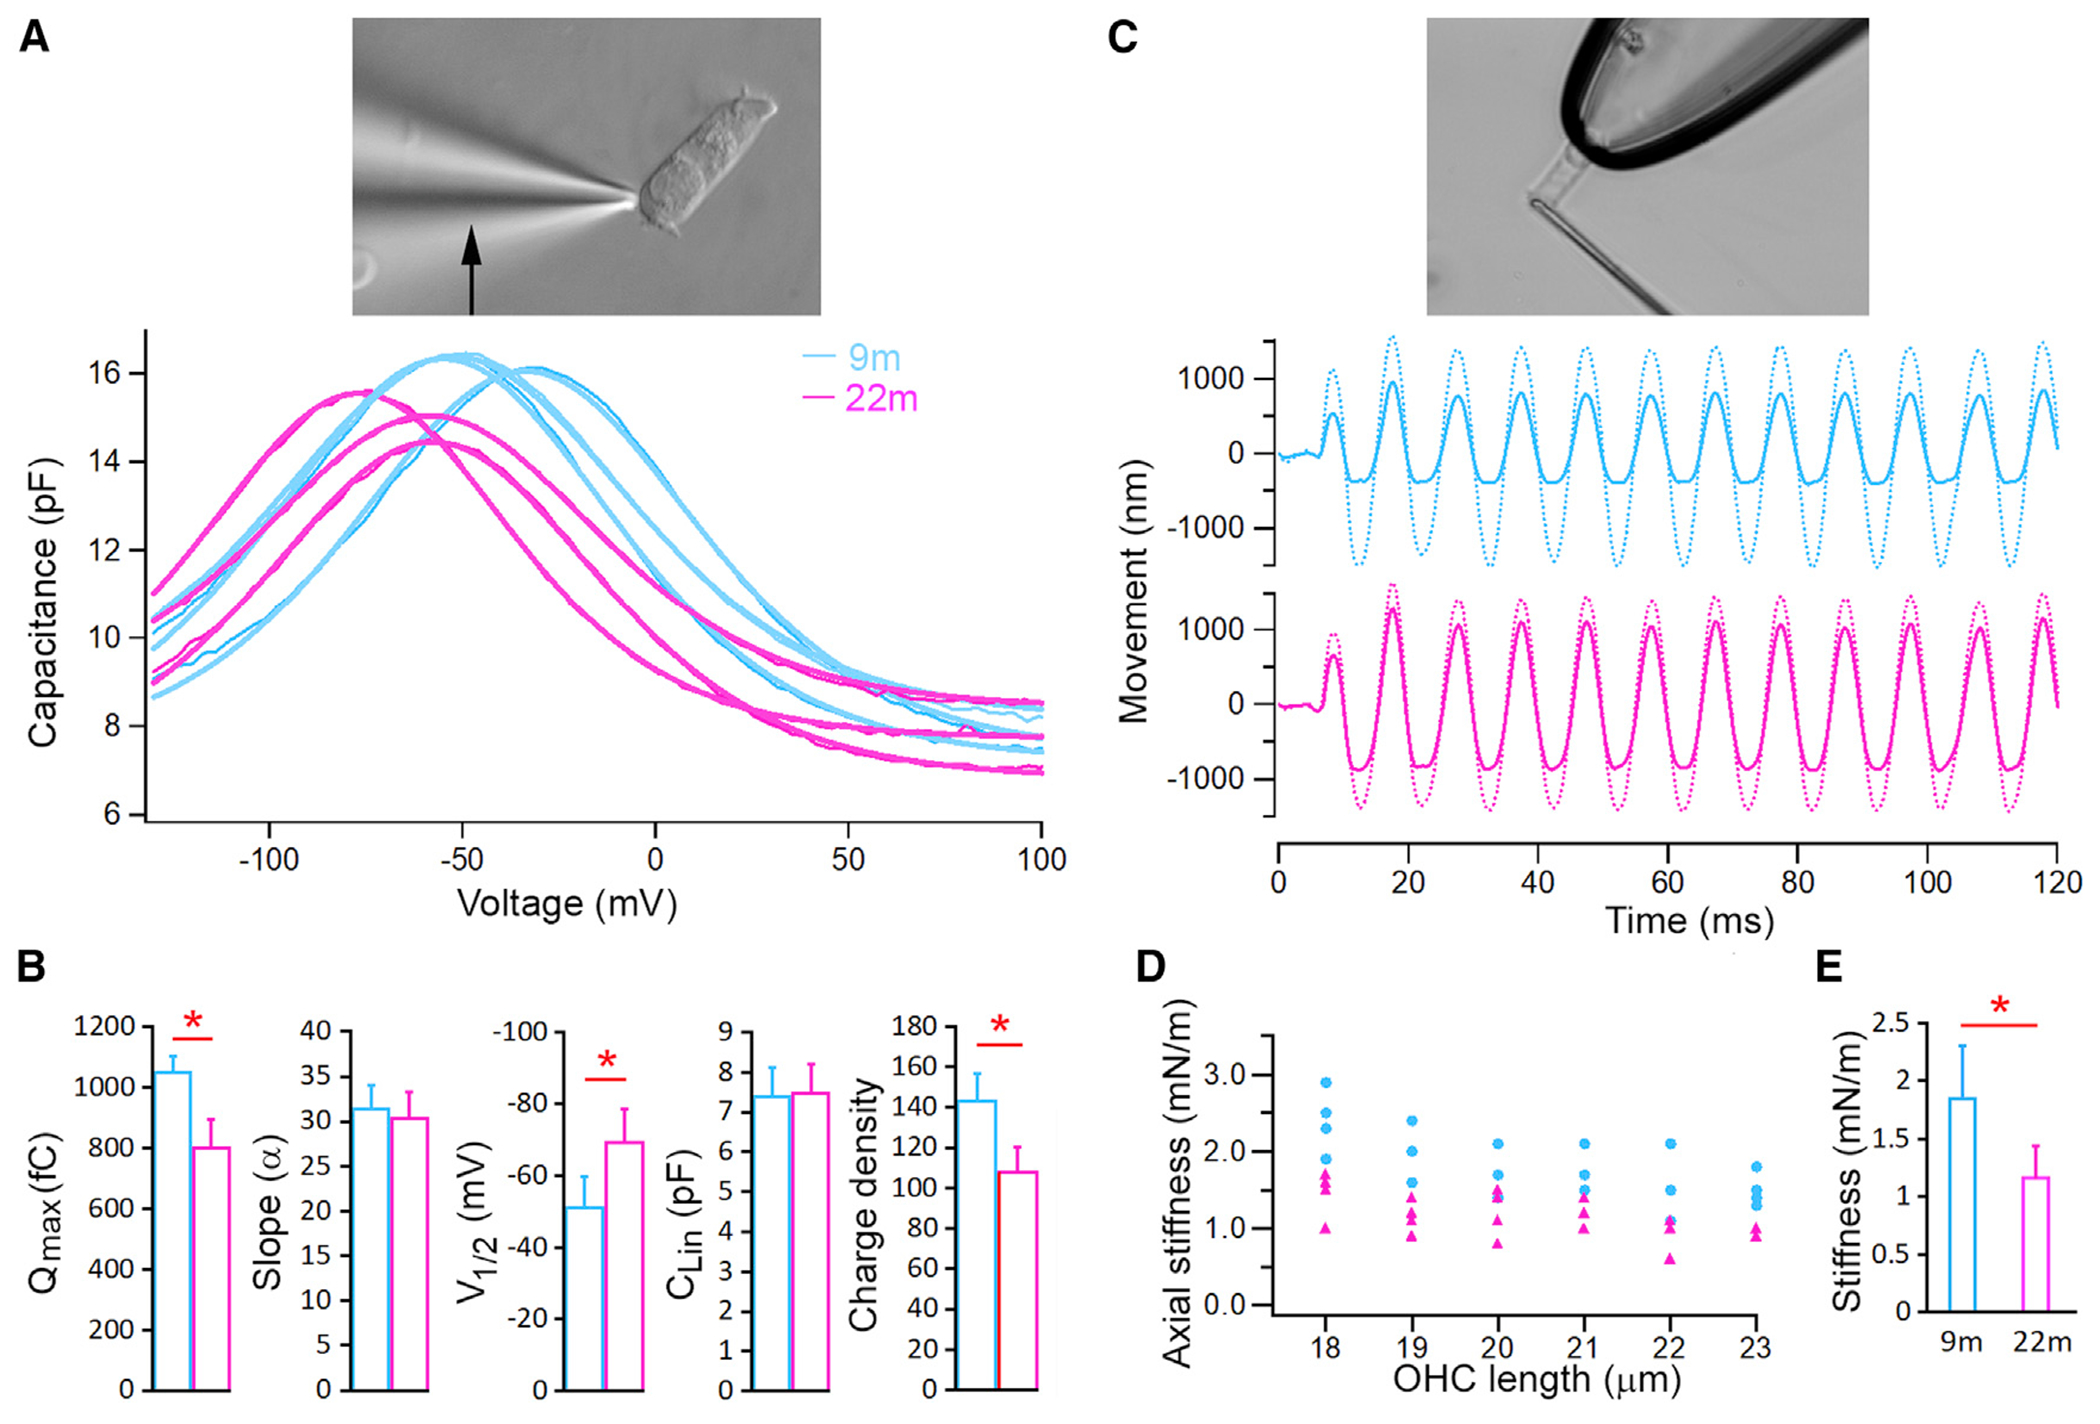
(A) Example NLC measurements from three 9-month-old and three 22-month-old OHCs. An image of an isolated OHC under voltage-clamp recording is shown on the top. Heavy lines in the plot are curve fitting using a two-state Boltzmann function relating nonlinear charge movement to voltage.
(B) Mean values (±SD) of five parameters computed from curving fitting. Red asterisk marks statistical significance between the two age groups. p values = 1.47E-09 (Qmax), 0.37 (slope), 5.6E-06 (V1/2), 0.72 (Clin), 4.85E-08 (density).
(C) Examples of free fiber (dotted line) and loaded fiber motions (solid line) obtained from 9- and 22-month-old OHCs. Image of an isolated OHC held by a microchamber and loaded with a fiber (adopted from Dallos et al., 2008) is shown on the top panel.
(D) Axial stiffness of individual OHCs and their resting length; each data point represents measurement from one OHC.
(E) Mean axial stiffness (±SD) of 9- and 22-month-old OHCs. A red asterisk indicates statistical significance between the two age groups (p = 7.6E-07; n = 20 and 22 for 9- and 22-month-old OHCs, respectively).